
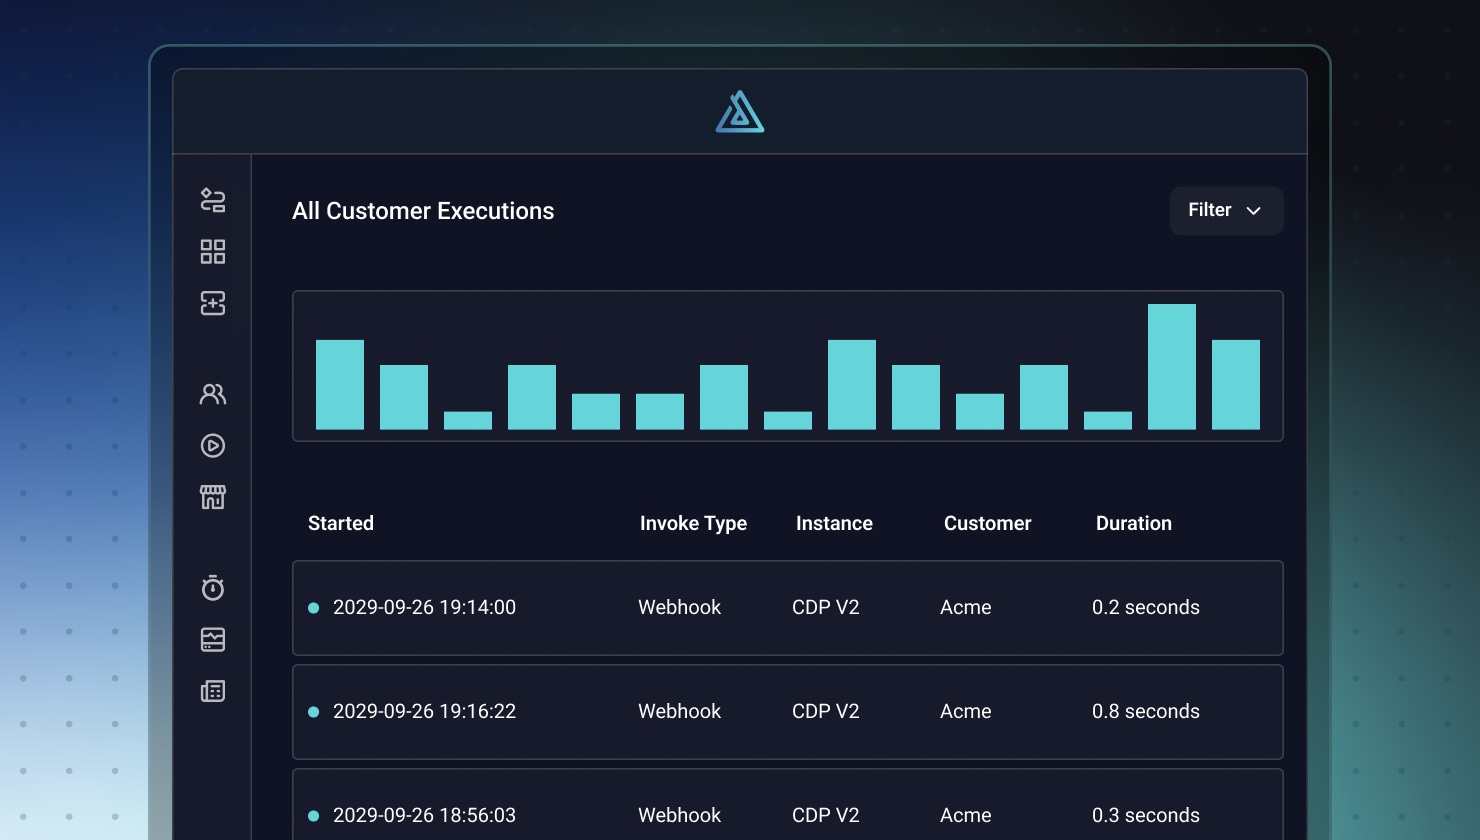
- A rebuilt executions experience splits finding a run from understanding it into two dedicated pages. Filter by trigger payload, open a detail view leading with a plain-language error and step-by-step timeline, and replay one or many executions at once.
- Filter executions by trigger payload. Filters can also combine conditions, isolate one flow across every instance, and narrow to any time within the 14-day retention period.
- A failed execution now leads with a plain-language error. A step-by-step timeline shows which branch ran and how loops iterated, with batches and retries collapsed so a large sync doesn't bury the failure.
- Named execution sections let a CNI run be read as a sequence instead of a block. Developers wrap onExecution logic with logger.section() and logger.sectionEnd(), so support can see exactly which section failed and open its logs directly.
- Log search now covers the full 14-day retention window. Execution log tables also show trigger payloads and step results alongside messages, so support can confirm what a step returned.
How do you troubleshoot a failed integration without the person who built it?
Customers judge your product by whether their integrations work. When one fails, someone on your team gets a ticket. Usually that's support, CS, or whoever manages deployments, not the developer who built the integration.
The one who gets the ticket can often see that something failed but not why. They can't find the execution behind the customer's report, and the logs sit in a scroll box. So the issue goes back to the original builder, or to Prismatic, and everyone waits.
Troubleshooting is based on tribal knowledge held by one or two people. Problems surface only after your customers report them. And teams hesitate to adopt code-first integrations (CNI) because they worry their support team won't be able to troubleshoot code it didn't write.
Over the past several months we've been redefining how visibility works across Prismatic to fix this. The new executions experience is the biggest piece of that work, and it's live today.
What's in the release
The executions page used to do two jobs: show a single execution, and let you sift through thousands of them. It did neither well. This release splits those jobs into separate pages and adds structure for code-first integrations.
The platform now has:
- A list view for finding executions and spotting patterns across 14 days of history.
- A detail view for understanding a single run, with the error up front and a timeline.
- Execution sections for code-first integrations so that a CNI run can be read as a sequences.
We designed all three so someone who didn't build the integration can successfully troubleshoot an issue.
Watch the video overview, or continue reading for all the details.
Find the right execution
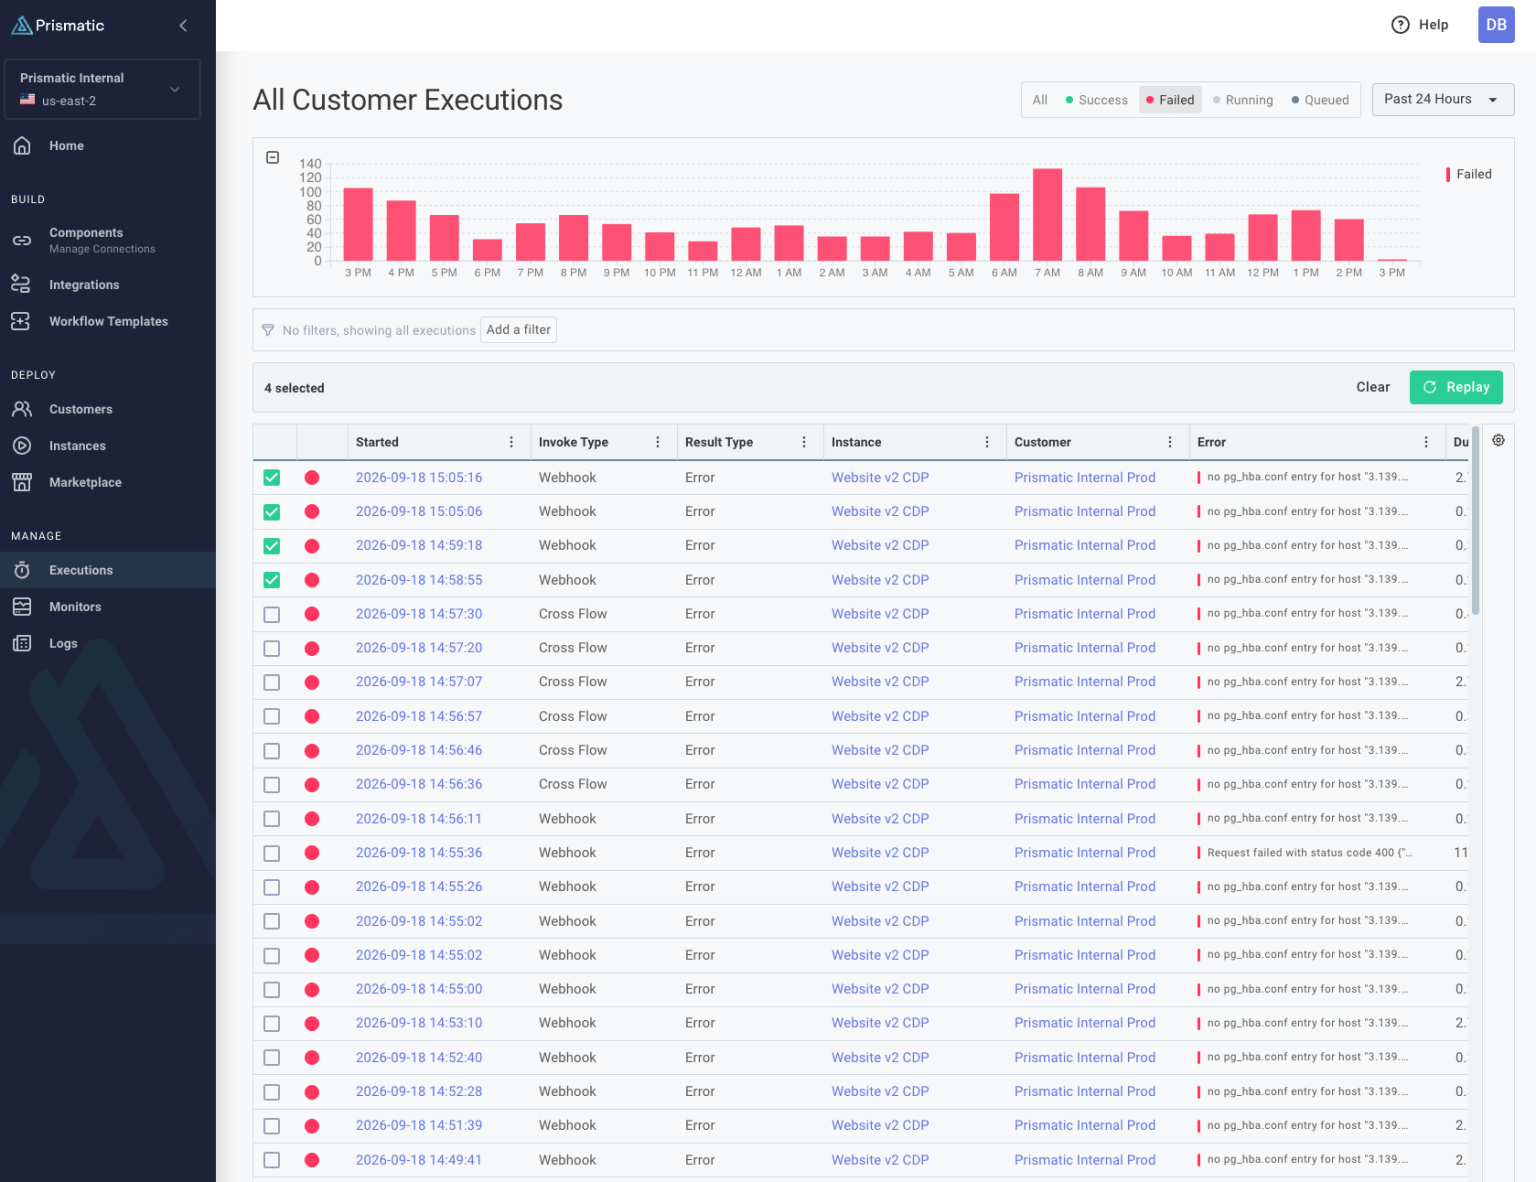
The list view is built for filtering and triage for every instance, and it now shows up wherever you look at executions: the top-level executions page, a customer's executions, or an instance's executions.
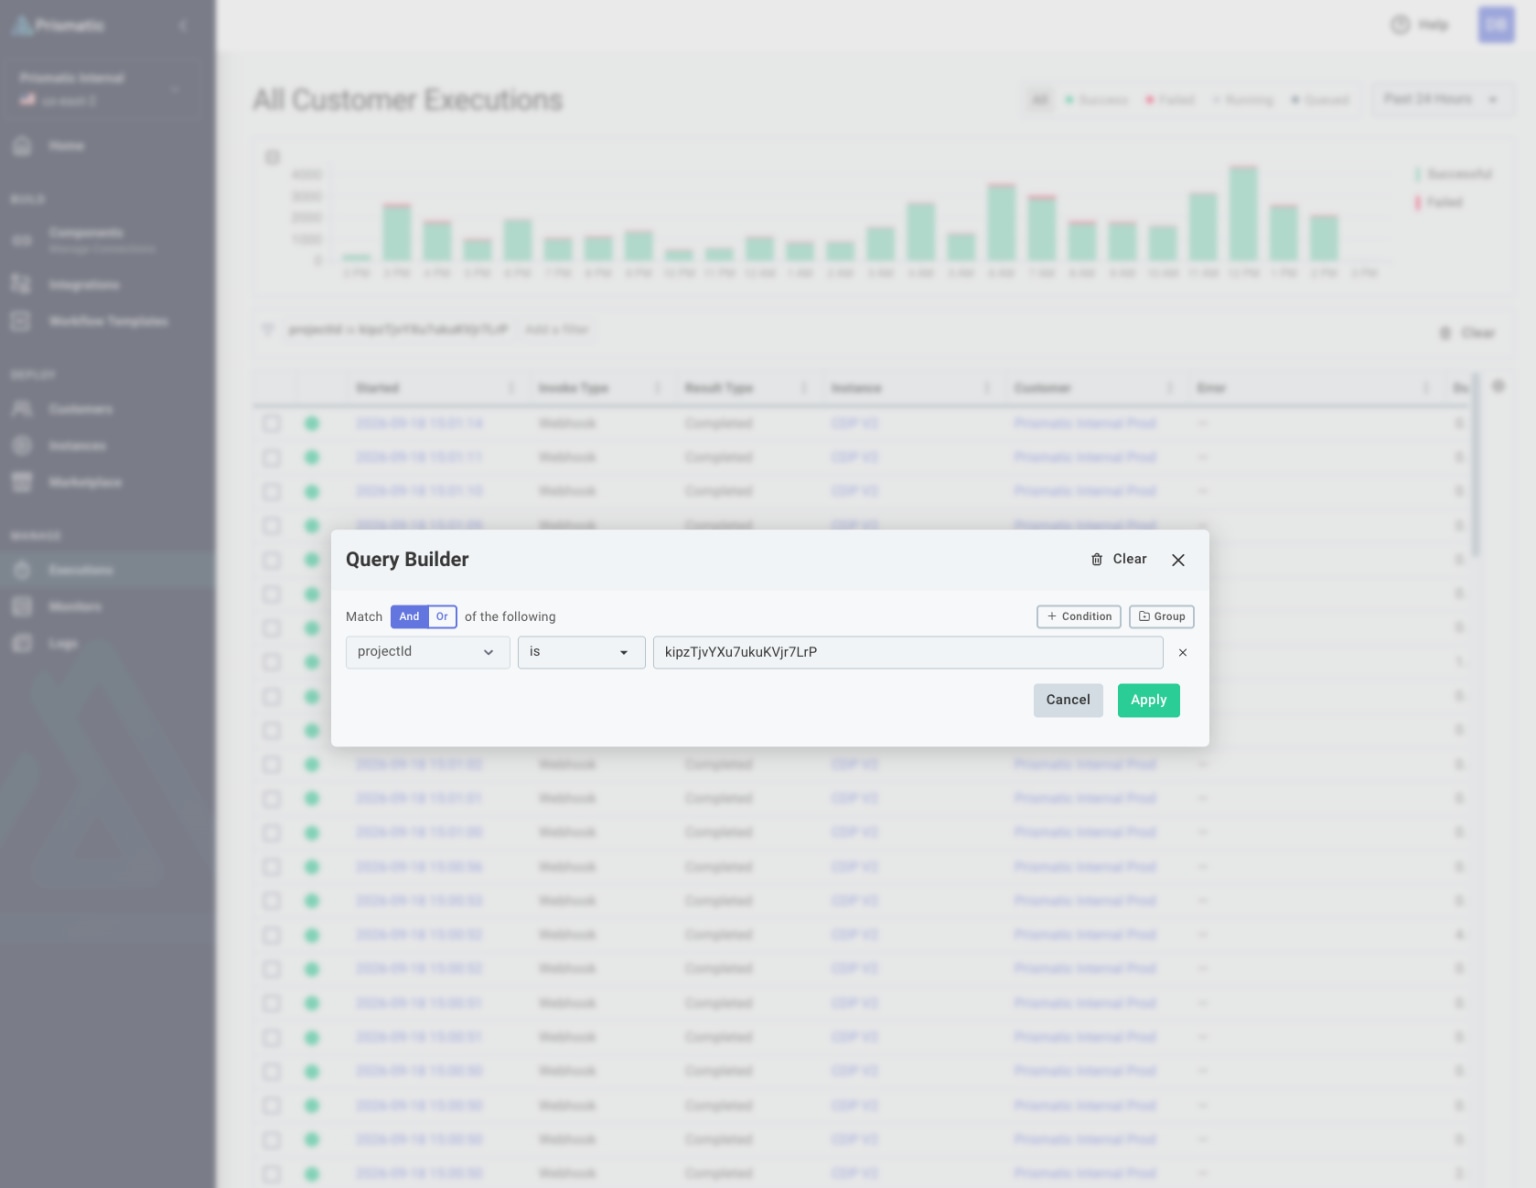
- Filter by trigger payload. A customer says order 48213 never synced. Add a filter on that ID and land on the execution that handled it (if the order number is in the trigger payload).
- Filter by flow across all instances. See how one flow behaves everywhere it's deployed, instead of opening instances one at a time.
- Pick a date and time range. Investigate a recurring failure across any window in the retention period. The old before/after/surrounding options are gone.
- Filter by status to isolate failures.
- See successes and failures over time. A chart above the results shows data for the selected window. Click a bar to narrow to that period.
- Combine conditions. Stack AND/OR filters when one field isn't enough to isolate the pattern.
- Bulk replay from the results list. Once you've fixed an issue, select the failed executions and replay them together instead of one by one.
- Configure your columns and drill in with one click. Set up the layout you need, then open any execution in the detail view.
Understand what happened and why
The detail view replaces the old execution panel with a dedicated page for a single run. It leads with the error in plain language, so you see what went wrong first.
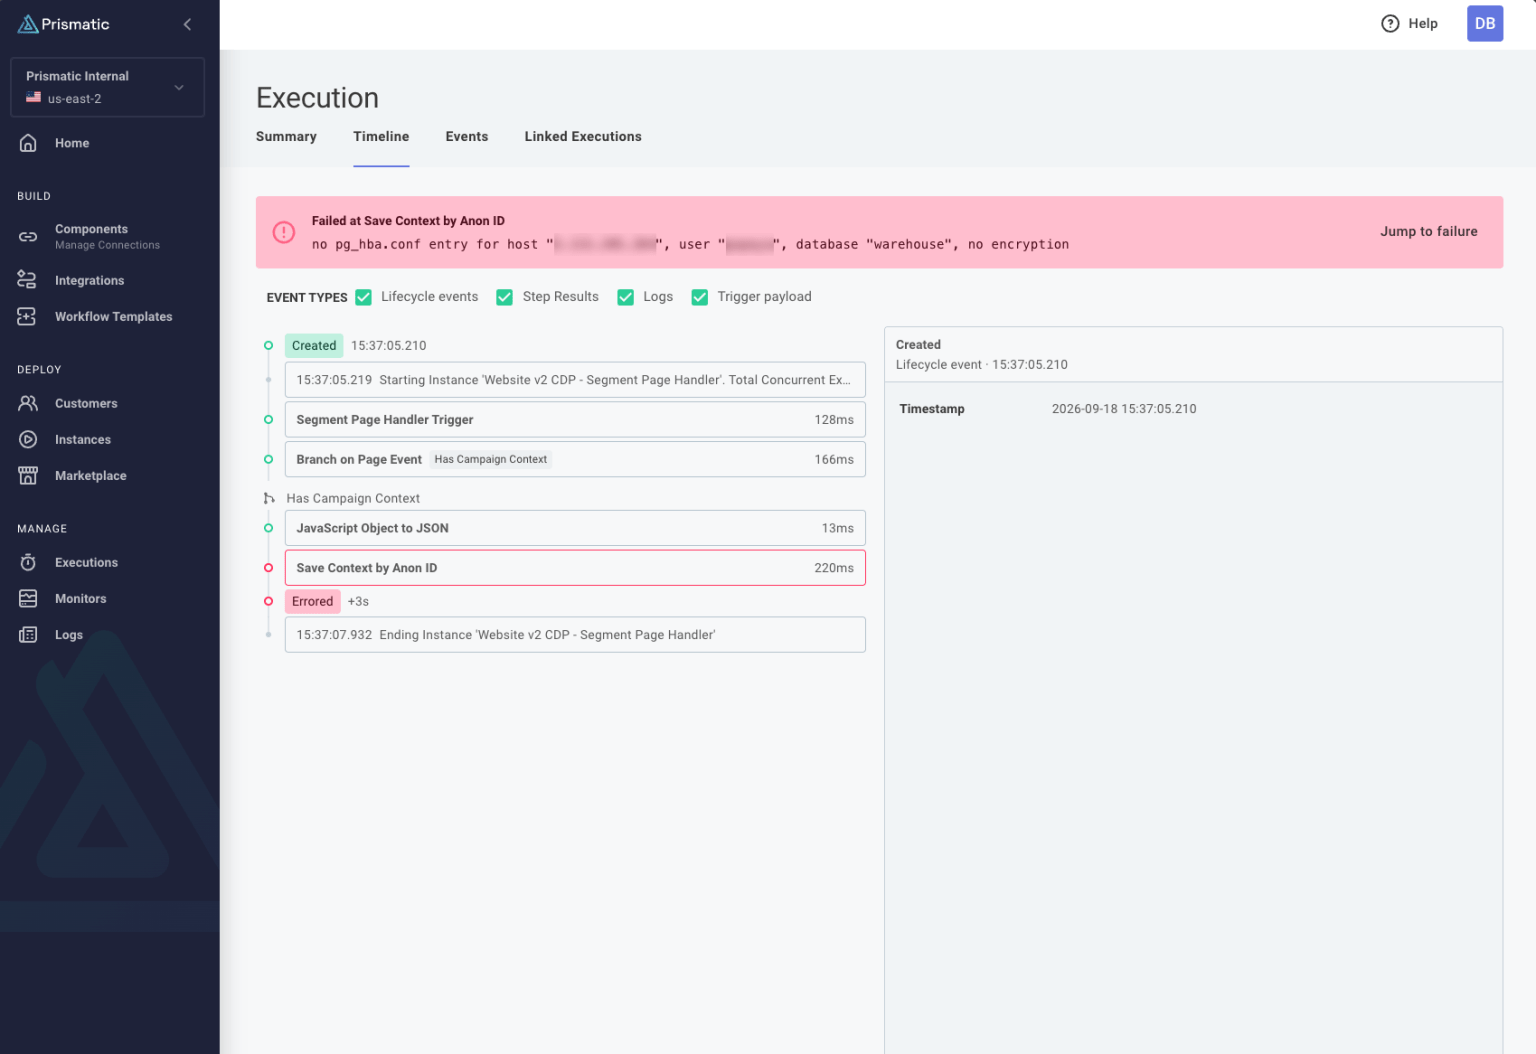
Below the error, a timeline shows what the execution did, step by step, including which branch it took and how loops iterated. Batches and retries collapse into their own views so a large data sync doesn't bury the data you're looking for. Expand any step to see its logs and output, or open the Events tab to filter every log and event in the run.
You also get the trigger payload and per-execution outputs, a replay button in the header, and one-click copy of the execution ID and URL to hand context to whoever needs it.
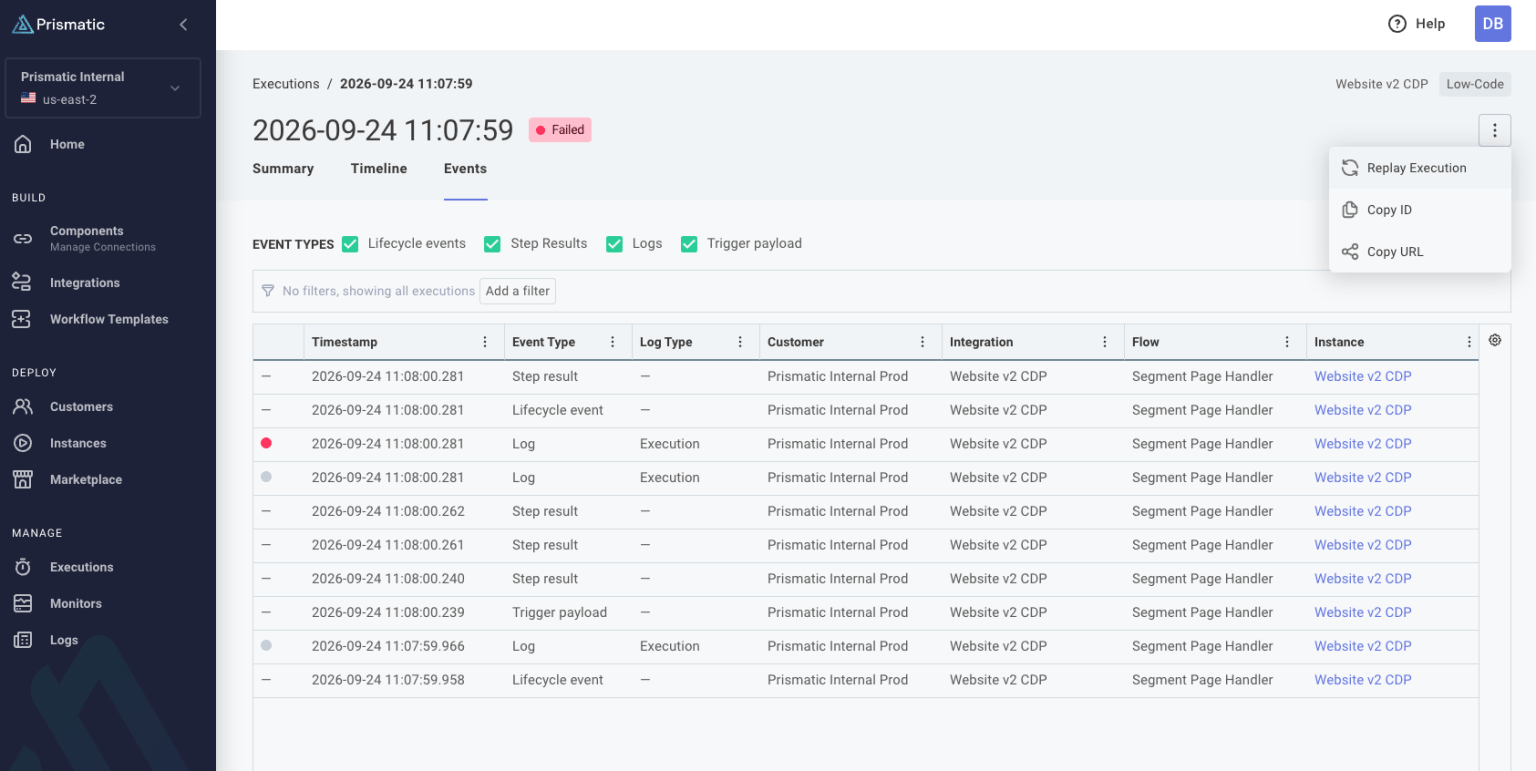
You can decide quickly what failed, why, and whether you can fix it yourself or need a developer. When it requires a developer, they have the execution link and context immediately, instead of starting from scratch.
Structure for code-first integrations: execution sections
Low-code integrations divide their work into discrete steps with inspectable results. A CNI runs as a single step, so when it fails, someone who didn't write the code gets one error plus whatever the developer chose to log.
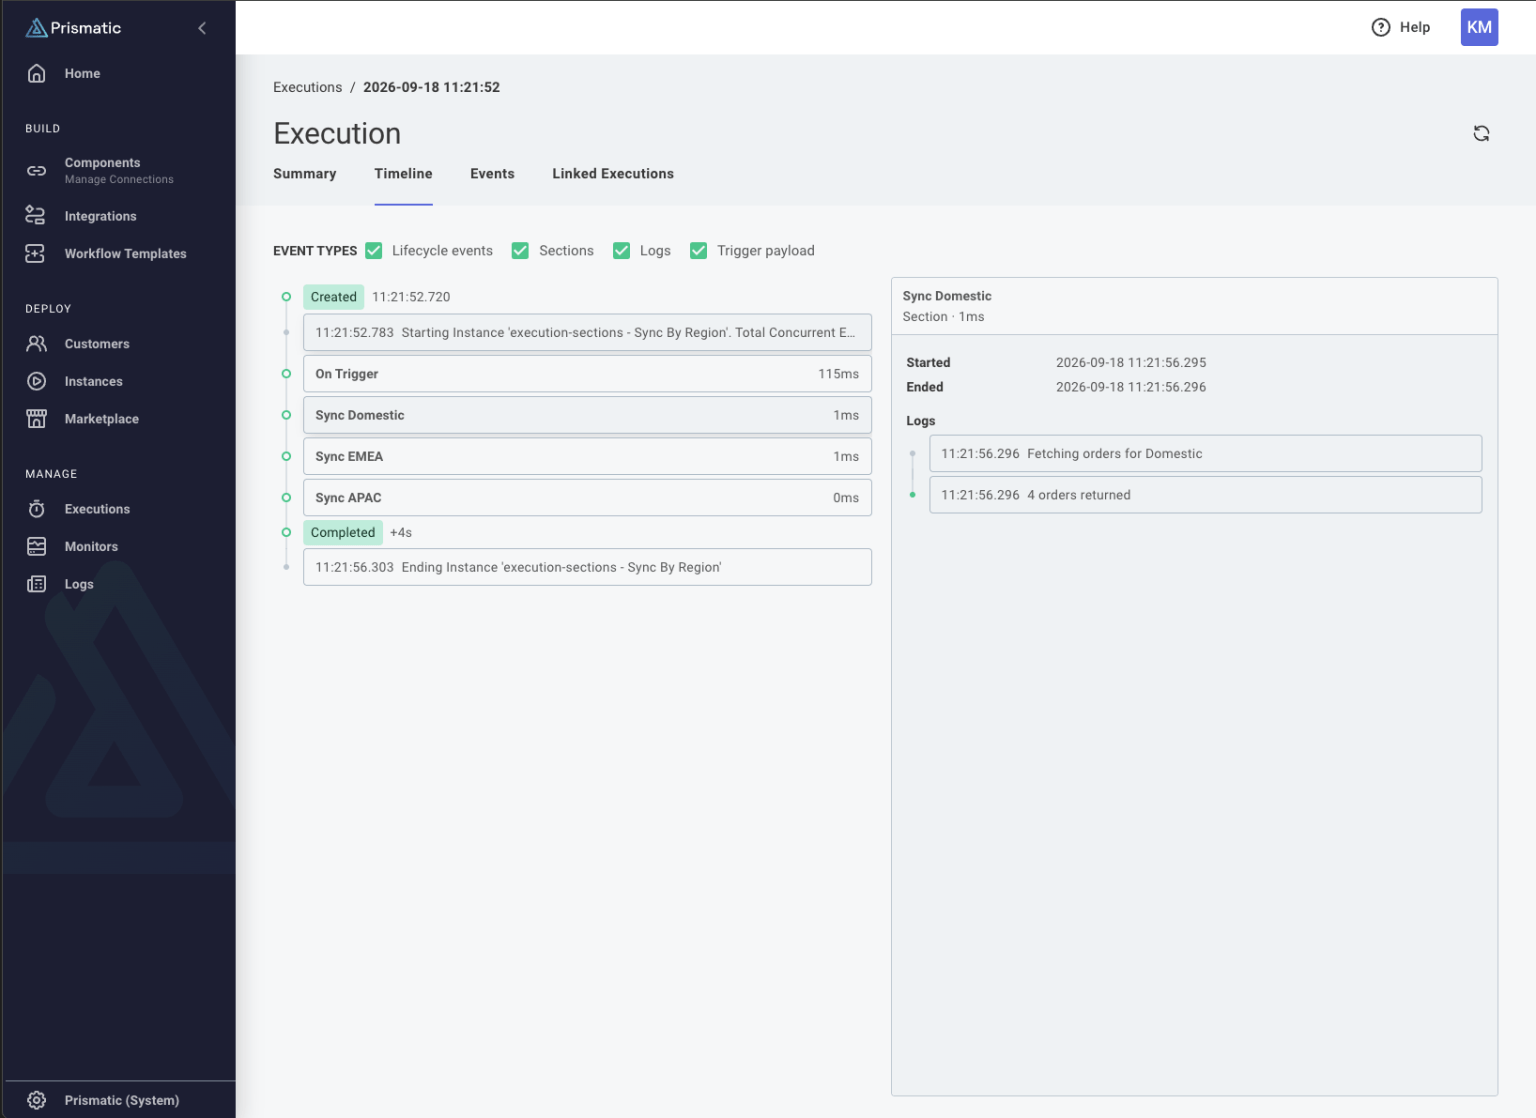
Execution sections change that. The onExecution logic in CNI is wrapped in named sections using two calls in the SDK, logger.section() and logger.sectionEnd() . It can optionally include an output object when a section ends. Every log written inside a section is tagged to it.
In the detail view, a CNI execution then shows up as an ordered list of named sections with status and timing. Support can see which section failed and open that section's logs. Developers see the same sections in the test runner and in the CLI log tail while they build, so they can confirm the structure reads as intended before deploying.
Sections are opt-in and incremental. Developers can add them to the parts of an integration that matter most for support and leave the rest alone. The code-native docs cover how to add them.
See the trend before your customers do
Execution-level detail is only useful if you know where to look. Earlier this year, we added aggregate views across the app so you can answer "Are failures increasing?" and "Which integration or customer is driving it?" before you open a single log entry.
The integration landing page has execution health charts and clickable stat boxes. Instance and customer summary tabs show aggregate execution metrics. The home page has an instance operations chart, and the Execution Limits tab shows tenant concurrency utilization. Charts are interactive, so you can click a spike and drill into the executions behind it. The Monitors section has also been renamed Alerts.
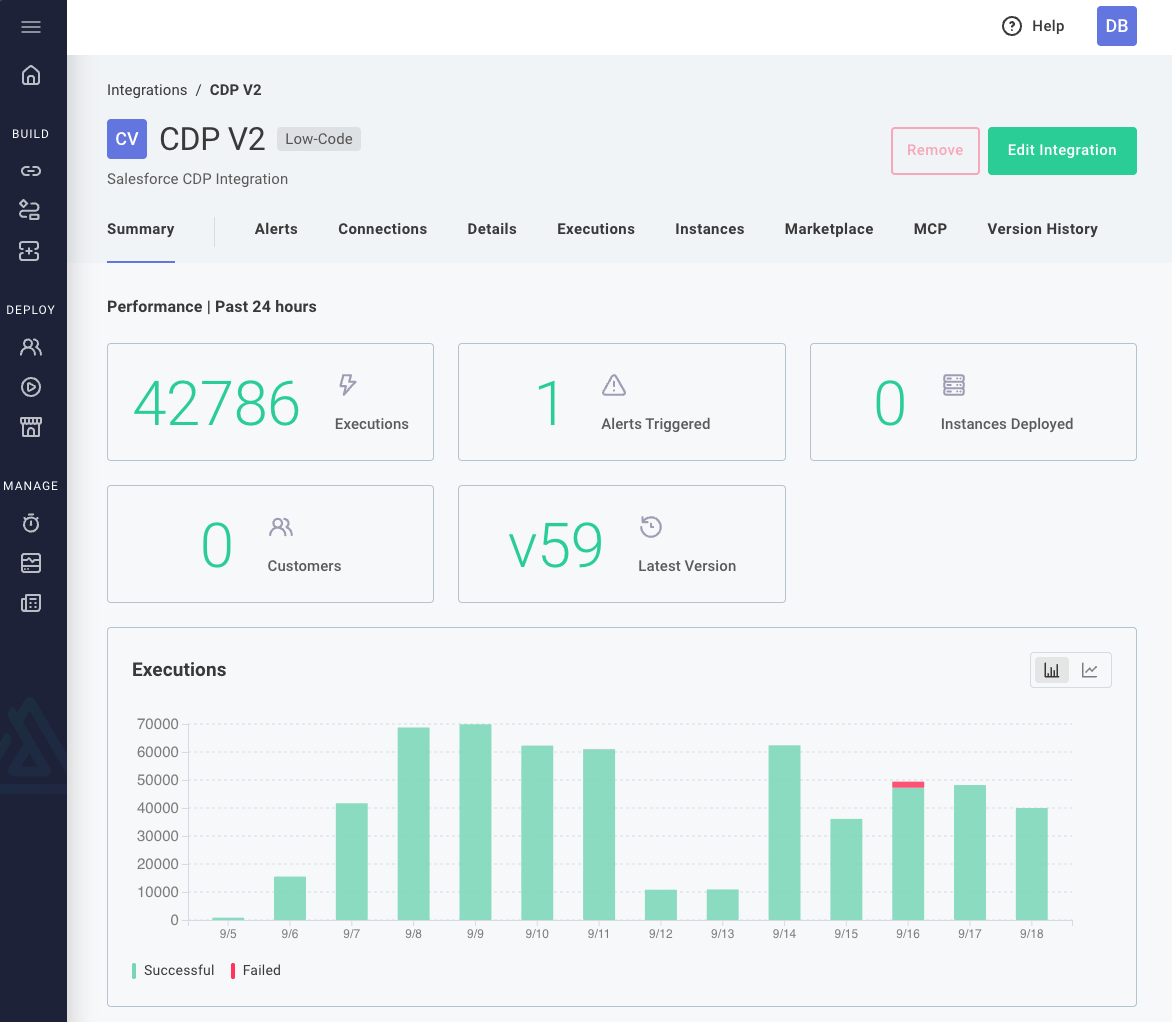
The visibility work we've done covers three levels, answering these questions:
- At the organization level – Are there spikes or unusual trends across integrations and customers?
- At the integration level – Which integration, instance, or customer is driving it?
- At the execution level – What happened in this run, what failed, and why?
Built on faster, deeper log search
Earlier this year, we moved observability data onto a search-optimized foundation. Log search is faster and more reliable for high-volume customers; the searchable window expanded from 48 hours to the full 14-day retention period, and the default search window grew from one hour to 24 hours. Execution log tables now also show trigger payloads and step results alongside log messages, so you can verify what data arrived on a trigger or what a step returned without adding custom logging code or rerunning the integration.
None of this requires any action on your side, and it's what makes filtering on payload data across 14 days of executions fast enough to use. One thing to note, however, is that a completed run takes about a minute to show up in the list view.
What this means for your team
Support and CS can tie a customer-reported record to the exact execution, read a clear error, and close more issues without escalating. Bulk replay turns a repetitive recovery task into a single action. Operations and deployment managers get a clear view of integration health across instances and customers, plus a troubleshooting process that works for everyone.
Developers get fewer interruptions for routine issues. And when something does need code work, it arrives with the execution ID, searchable logs, and context. For product and platform leaders, that means a better chance of catching issues before customers report them, and one more reason to adopt CNI.
Availability
The new executions list, detail view, and execution sections are available today, with no opt-in and no pricing change. They're available for both low-code and code-first integrations. Execution sections do require updating to the latest version of the Prismatic SDK.
Log in to Prismatic to explore the new executions area, read the executions docs for a walkthrough, or see the changelog for the full list of what shipped. If you're evaluating an embedded iPaaS and want to see how this works, book a demo.
Common questions
Execution visibility is the ability to see, search, and understand every run of a live integration: whether it succeeded, where it failed, and why. In Prismatic, it spans aggregate health charts, a filterable executions list, and a detail view of each execution, including logs, trigger payload, outputs, and a timeline of steps or sections.