


Post 6 of the Integration Health series
- Retry rate and recovery rate answer different questions. Retry rate is the share of executions needing at least one retry, and recovery rate is the share of those retried executions that eventually succeed within the retry policy.
- The unit is the execution, not the attempt. An execution that retries several times counts once in the retry-rate numerator. Keep first-run success as a separate outcome.
- Recovery rate changes how you understand retry volume. A high retry rate with high recovery suggests the policy is handling temporary failures. A high retry rate with low recovery means repeated attempts aren’t resolving the underlying issue.
- Retries delay the diagnosis of persistent failures. An expired credential, validation error, or schema mismatch fails on every retry, postponing the alert.
- Decide what counts as a retry. Specify whether the metric includes automatic retries, manual replays, or both, and report them separately when they represent different issues.
A failed API request does not always mean an integration is broken. A timeout or temporary service interruption may clear on a later attempt. Or a retry might recover the work without anyone intervening.
But retries can also hide persistent issues. If an expired credential or schema mismatch causes every attempt to fail, another retry will only delay diagnosis and extend the time before anyone sees the issue.
Retry rate and retry recovery rate can help you tell the difference. Together, they show how often executions need another attempt and how often those attempts succeed.
If your integrations seem fine, but you suspect retries may be hiding persistent errors or increasing customer wait times, this is for you. Tracking retry rate and retry recovery rate is essential for engineering, support, or DevOps teams that need to look past surface-level success metrics and understand whether automatic retries resolve transient issues or kick the can.
Watch the video
Watch the overview, or keep reading for the details.
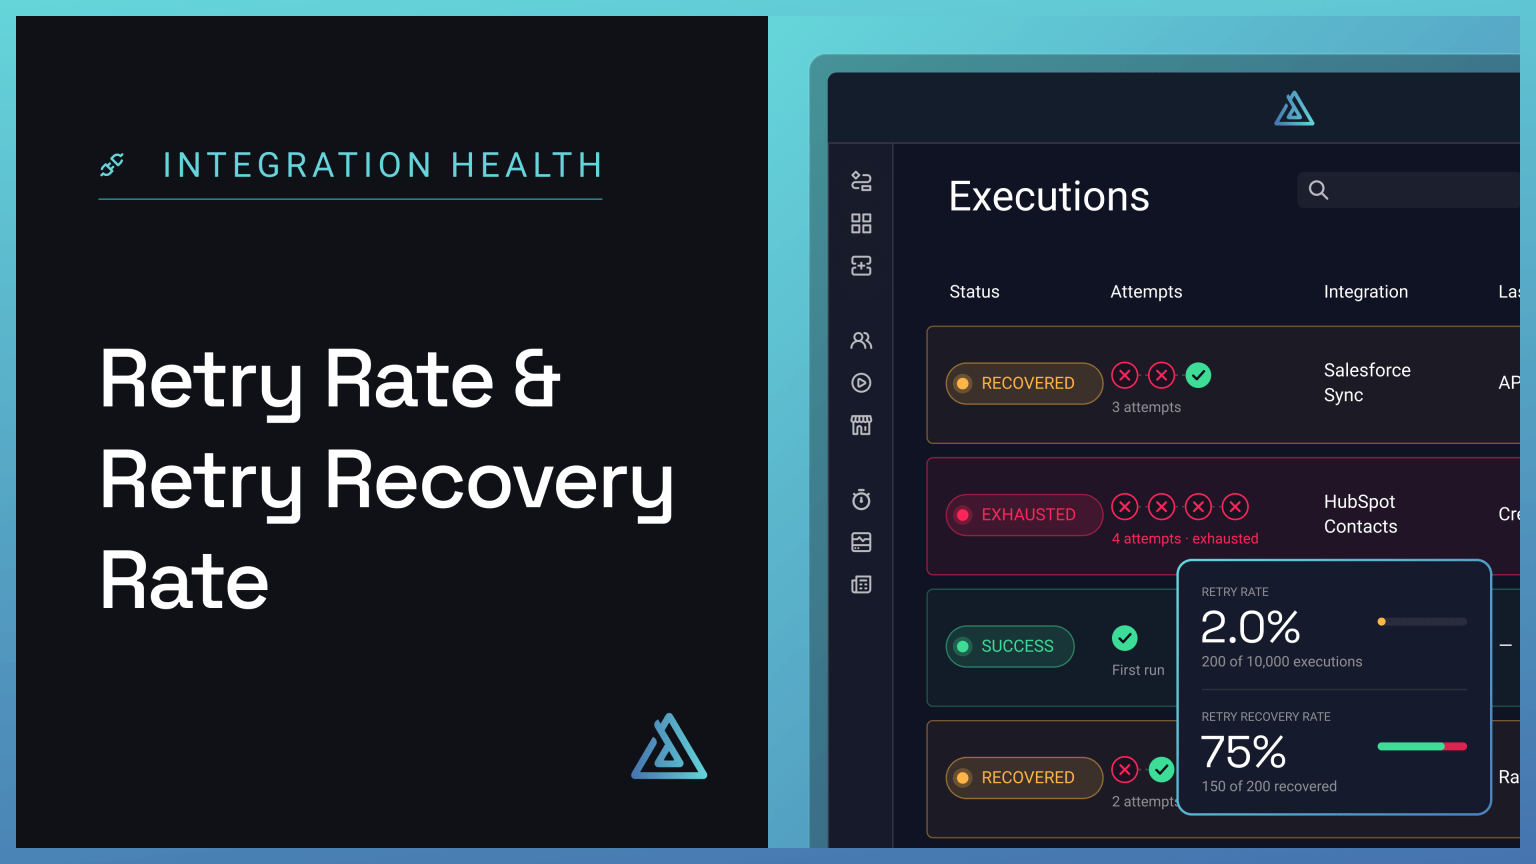
What are retry rate and retry recovery rate?
Retry rate is the percentage of executions that require at least one retry during a defined period.
Retry rate (%) = Executions with one or more retries ÷ Total executions × 100
Retry recovery rate is the percentage of retried executions that eventually succeed according to the defined retry policy.
Retry recovery rate (%) = Retried executions that eventually succeeded ÷ Retried executions × 100
Count an execution that retries several times once in the retry-rate numerator (not once per retry attempt). The unit is the top-level execution, not each attempt made to complete it.
For example, if 200 of 10,000 executions require a retry, the retry rate is 2%. If 150 of those 200 executions eventually succeed within the retry policy, the retry recovery rate is 75%. The remaining 50 did not recover within the policy.
Retry rate
Retry recovery rate
Keep retry recovery separate from first-run success. An execution that succeeds after retries may count as eventually successful, but it did not complete cleanly on its first attempt. Reporting both outcomes makes the distinction clear.
Why retry context matters
A high retry rate is not automatically a sign of poor integration health. If retries recover temporary failures, they may help an integration continue without manual intervention (from either the customer or support).
The recovery rate changes how you interpret that retry volume. A high retry rate with a high recovery rate can point to temporary failures that the retry policy handles effectively. A high retry rate with a low recovery rate suggests that repeated attempts are not resolving the underlying issue.
The failure category matters, too. Retrying an integration that experiences a temporary network error is helpful. Repeating an authentication, validation, or persistent schema failure is unlikely to fix it. Retries should not conceal bigger problems or postpone actionable alerts. And when an operation can have negative side effects, retry behavior needs to account for duplicate processing to ensure that you don't make the issue more serious.
However, a low retry rate is also not proof that everything is healthy. It could mean that executions are succeeding on the first attempt, but it could also mean that retry behavior is not configured for relevant failures or that retry events are not captured in your data.
How to measure retry performance
- Define the execution and measurement window. Decide what counts as one top-level execution and which executions belong in the denominator. Use a consistent time window and document exclusions. Do not count each retry attempt as a separate execution.
- Define what counts as a retry. Specify whether the metric includes automatic retries, manual replays, or both. If you include both, report them separately when they represent different operational workflows.
- Define the retry window and recovery outcome. Record when an execution enters retry handling and when it succeeds or exhausts its retry policy. An execution is recovered only if it succeeds within the policy you have defined. Decide how to classify executions that are still retrying at the end of the reporting window.
- Report the companion measures together. Track retry rate, retry recovery rate, and exhausted-retry rate. Keep first-run success visible as a separate outcome. Trend these measures alongside overall execution success and duration; a rising retry rate may affect both reliability and the time it takes to finish work.
- Segment and investigate. Break results down by connector, error category, customer, and flow. A portfolio average can hide one connector or customer with a recurring failure pattern. Preserve enough failure context to distinguish transient dependency problems from authentication, validation, or data issues.
What Prismatic provides
Prismatic execution history and available GraphQL execution and replay data can help identify executions that were retried, recovered, or exhausted, where the relevant fields and permissions are available. Teams can also stream execution data to observability platforms like Datadog to help identify patterns.
Retries should handle proper transient failures – not used to mask authentication, validation, or persistent schema problems. The metric definitions, reporting window, inclusion rules, and targets still belong to your team.
Where to start
Start with a recent, defined time window. Count each top-level execution once, identify which executions required at least one retry, and determine which retried executions succeeded within the retry policy. Then compare retry rate, retry recovery rate, exhausted retries, and first-run success by connector, error category, customer, and flow.
As with many other metrics, there's no universal baseline. You'll need to establish one that works for you to investigate the failures that recur or fail to recover. The goal is not to eliminate every retry but to understand when retries are solving temporary failures and when they are prolonging a problem that needs a different solution.
Series navigation
Post 5: Integration execution duration
Post 6: This one.
Post 7: Coming soon
View all the posts in the Integration Health series.

