Streaming Logs Externally
External log streaming
The external log streaming feature is available to customers on some pricing plans. Refer to your contract, or contact Prismatic support for details.
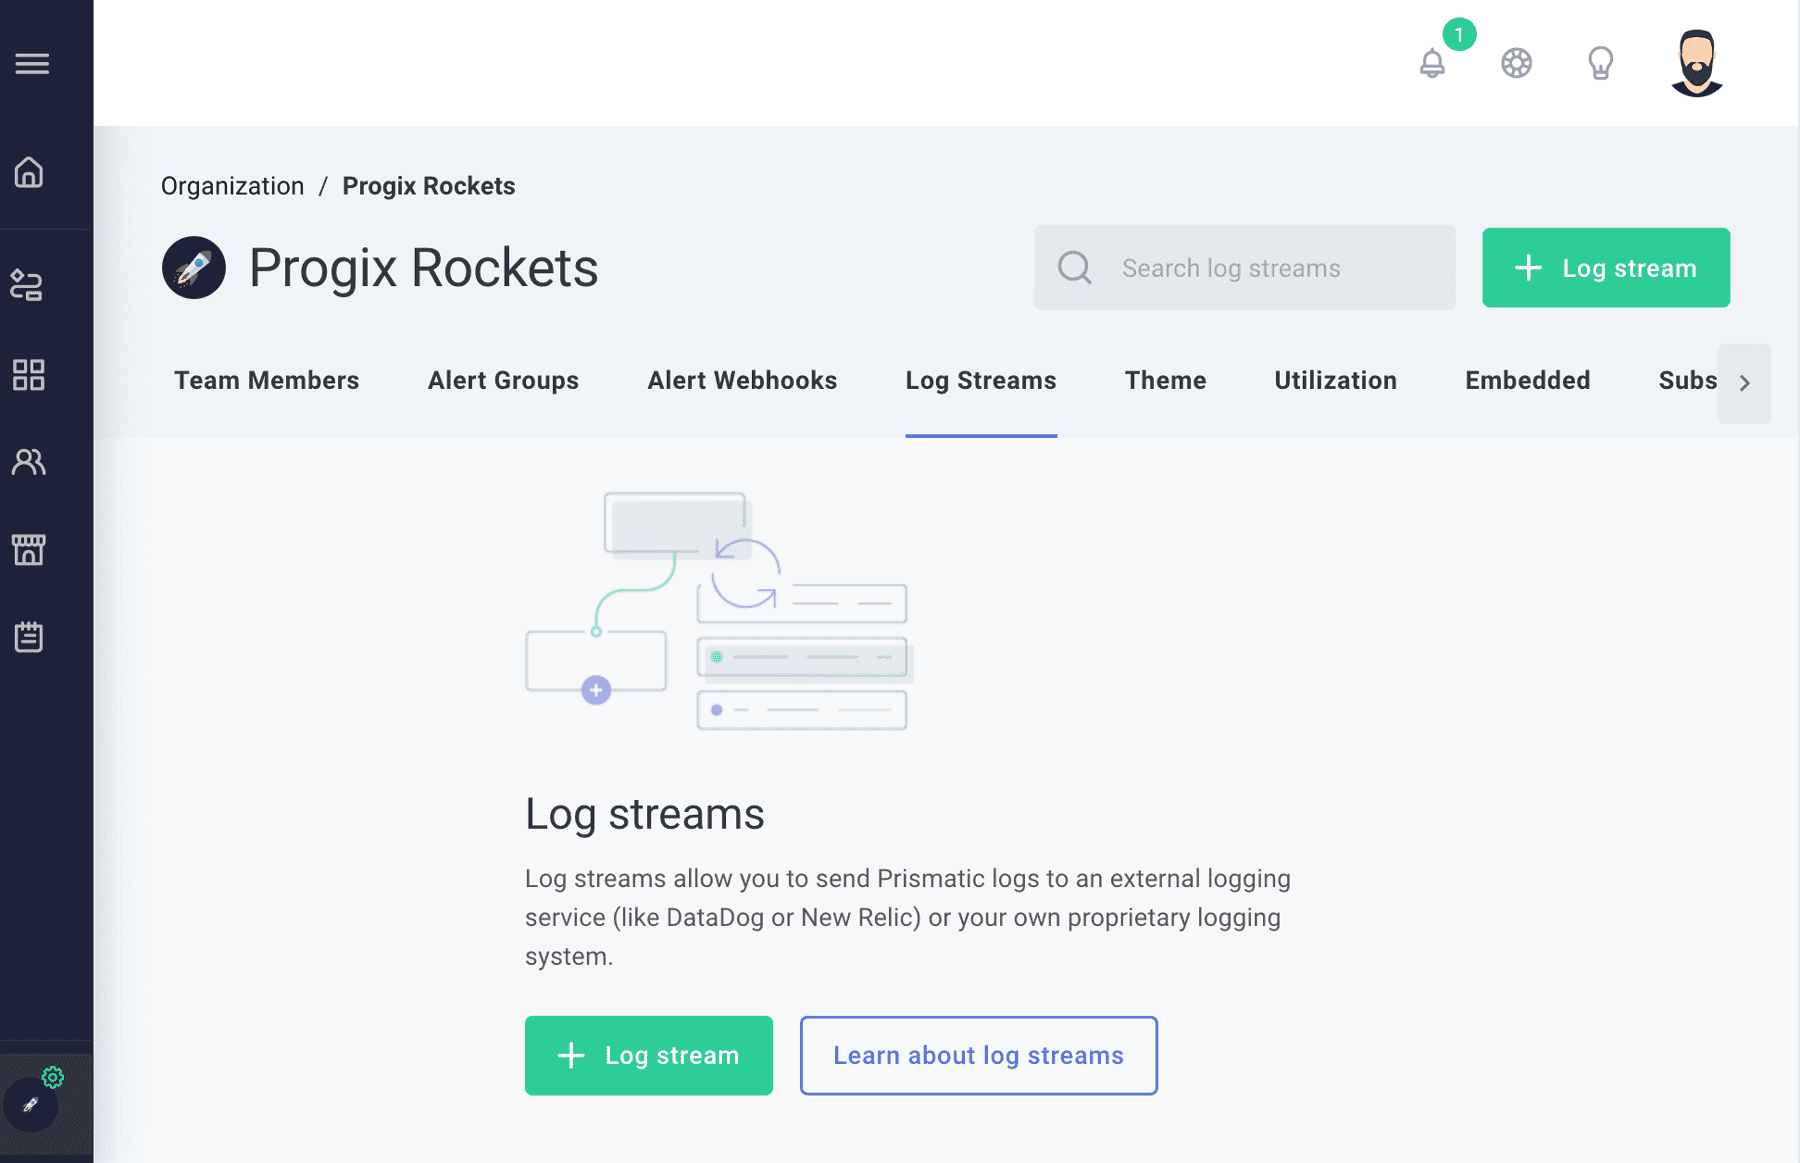
You can stream logs from Prismatic to external logging services (such as Datadog, New Relic), or to your own logging infrastructure. Most logging services accept HTTP POST requests with JSON payloads containing log data. To configure log streaming in Prismatic, you'll need to specify the destination URL, payload format, and any required headers (e.g., authorization or API keys).
To set up external log streaming, open Settings in the sidebar and select the Log Streams tab. Create a new log stream by clicking + Log stream.
Enter the destination URL and add any required headers (such as API keys or authorization tokens).

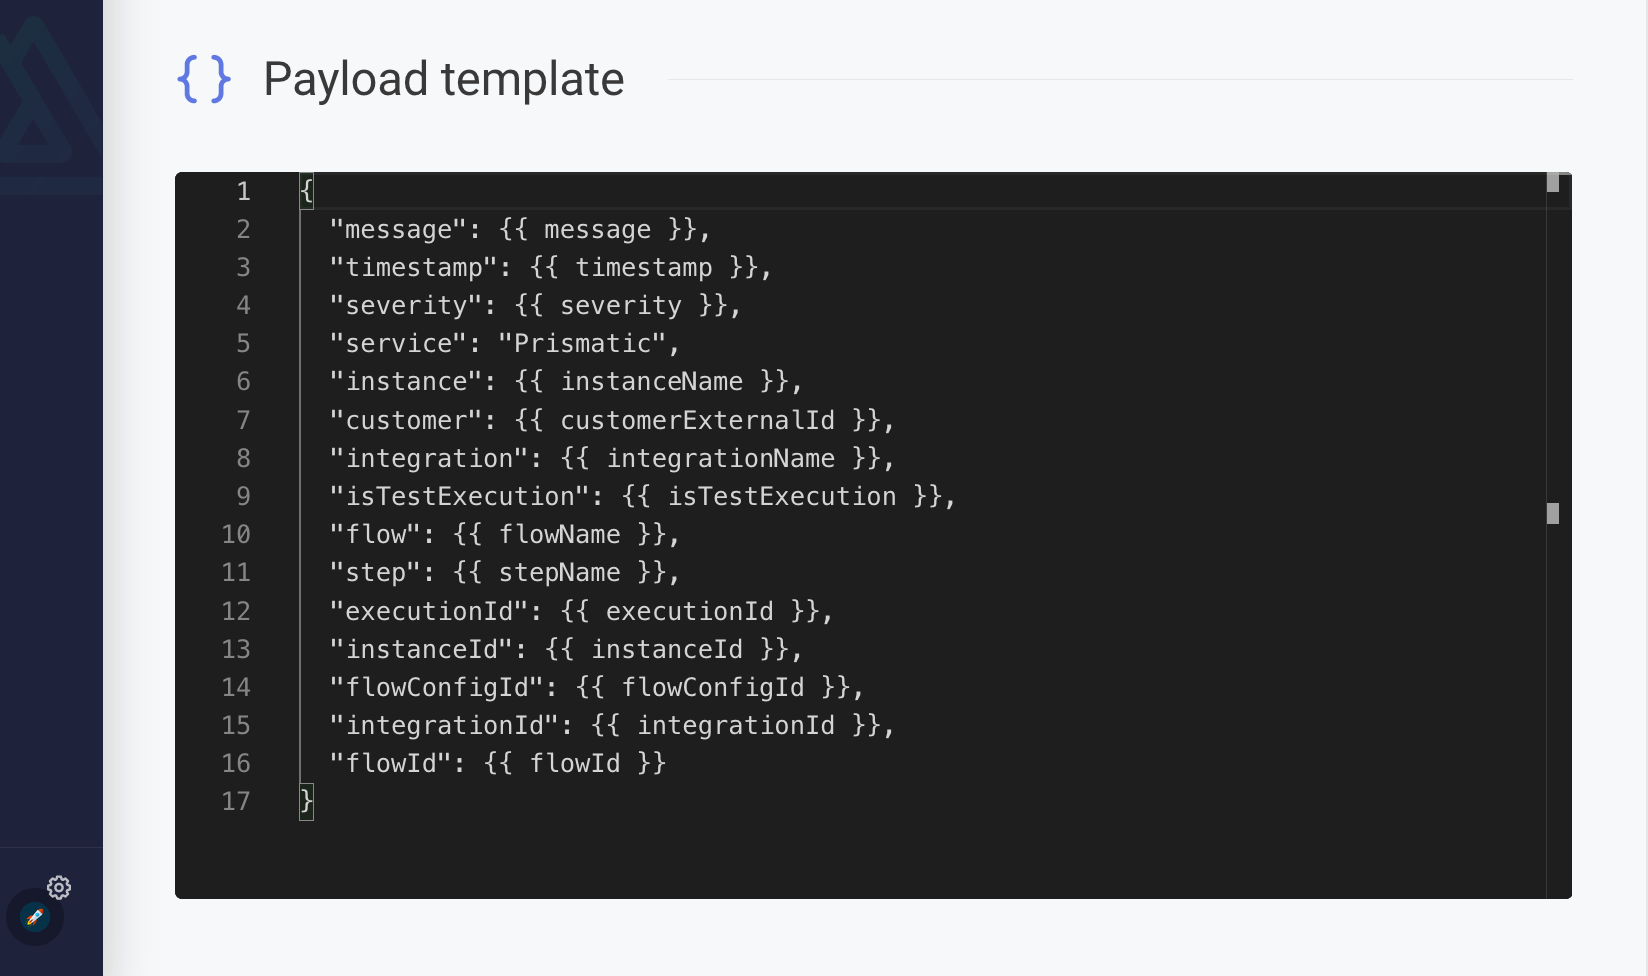
Next, you'll define a log message template. This template determines the structure of the log message Prismatic sends to your logging service. You can include placeholders for log content and metadata about the instance, customer, flow, and step.
The following placeholders are available and will be replaced with actual values when a log message is sent:
| Placeholder | Description | Example |
|---|---|---|
{{ timestamp }} | Timestamp in milliseconds since epoch | 1637087683123 |
{{ timestamp_s }} | Timestamp in seconds since epoch | 1637087683 |
{{ timestamp_ns }} | Timestamp in nanoseconds since epoch | 1637087683123000000 |
{{ timestamp_iso }} | Timestamp in ISO format | "2021-11-16T18:34:43.123Z" |
{{ message }} | Full log message | "This is a test" |
{{ severity }} | Log level (debug, info, warn, error, metric) | "warn" |
{{ severityNumber }} | Syslog severity level | 4 |
{{ instanceId }} | Global ID of the instance | "SW5zdEXAMPLE" |
{{ instanceName }} | Name of the instance | "Update Inventory" |
{{ instanceLabels }} | Labels assigned to the instance | ["label1", "label2"] |
{{ flowConfigId }} | Global ID of the instance's configured flow | "SW5zdEXAMPLE" |
{{ integrationId }} | Global ID of the deployed integration version | "SW5zdEXAMPLE" |
{{ integrationName }} | Name of the integration | "Update Inventory" |
{{ logType }} | Log type: "DATA_SOURCE", "CONNECTION", "EXECUTION", or "MANAGEMENT" | "EXECUTION" |
{{ flowId }} | Global ID of the deployed integration flow | "SW5zdEXAMPLE" |
{{ flowName }} | Name of the integration flow | "Remove inventory after order fulfillment" |
{{ stepName }} | Name of the step, if available | "Loop over order items" |
{{ isTestExecution }} | Indicates if the log is from a test in the integration designer | true |
{{ executionId }} | Global ID of the execution | "SW5zdEXAMPLE" |
{{ customerExternalId }} | External ID of the customer | "abc-123" |
{{ customerName }} | Name of the customer | "Acme Corp" |
{{ executionErrorStepName }} | Name of the step that resulted in an execution error | "Loop over order items" |
{{ durationMS }} | Duration in milliseconds of the execution | "1000" |
{{ succeeded }} | Whether the step or execution succeeded | "true" |
{{ errorMessage }} | Error message for the step or execution | "This is an error" |
{{ retryAttemptNumber }} | Number of retry attempts for the step or execution | "0" |
{{ retryForExecutionId }} | Global ID of the original execution in case of retry | "SW5zdEXAMPLE" |
This template works with most logging platforms, but you may need to adjust it for your specific requirements.
Default message template
{
  "message": {{ message }},
  "timestamp": {{ timestamp }},
  "severity": {{ severity }},
  "service": "Prismatic",
  "instance": {{ instanceName }},
  "customer": {{ customerExternalId }},
  "integration": {{ integrationName }},
  "logType": {{ logType }},
  "isTestExecution": {{ isTestExecution }},
  "flow": {{ flowName }},
  "step": {{ stepName }},
  "executionid": {{ executionId }},
  "instanceId": {{ instanceId }},
  "flowConfigId": {{ flowConfigId }},
  "integrationId": {{ integrationId }},
  "flowId": {{ flowId }},
  "executionErrorStepName": {{ executionErrorStepName }},
  "duration": {{ durationMS }},
  "succeeded": {{ succeeded }},
  "errorMessage": {{ errorMessage }},
  "retryAttempt": {{ retryAttemptNumber }},
  "retryForExecutionId": {{ retryForExecutionId }}
}
Testing log streaming
After saving your configuration, you can test your external logging setup by clicking the Test payload button at the top right of the log stream screen. Prismatic sends a test log message to your external logging system, substituting test values (e.g., "Test message", "Test integration") into your template.
Note: If your logging provider enforces CORS and blocks logs sent directly from the browser, the Test payload button may not work. In this case, save your configuration and run a test integration; logs from the execution will be sent to your external provider.
Logging metrics to an external service
In addition to log lines, you can use context.logger to emit objects containing metrics for external streaming.
For example, a code component can include:
logger.metric({ inventoryItem: { id: "123", price: 10.55, quantity: 3 } });
Your external streaming configuration can extract attributes from the object passed to metric().
For example:
{
  "message": {{ message }},
  "timestamp": {{ timestamp }},
  "severity": {{ severity }},
  "itemId": {{ inventoryItem.id }},
  "itemPrice": {{ inventoryItem.price }},
  "itemQuantity": {{ inventoryItem.quantity }}
}
When a metric log contains inventoryItem.id, those attributes are included in the payload sent to the logging system.
Messages without these fields simply omit them.
When logger.metric() is called, {{ message }} is the stringified JSON version of the object, and {{ level }} is set to 99.