Logging
You need comprehensive log access when building, deploying, and supporting integrations. When an alert monitor notifies your team of unexpected instance behavior, detailed logs provide insight into execution timing, step status, and error details. You can access logs for all instance invocations and test runs in Prismatic.
You can also stream logs to an external logging system for centralized analysis.
Log retention
Prismatic retains logs and step results for 14 days before automatically deleting them.
Disabling logs and step results
Your organization may need to disable log and step result storage for compliance reasons. To discuss retention policy adjustments, contact support. When you disable storage, Prismatic doesn't persist log and step result data in its database, and the data isn't available in the web app.
If your organization has custom retention policies, a toggle will appear in the instance configuration wizard to disable storage for specific instances.

Viewing logs for all customers
To view logs for all instances across all customers, select Logs from the left-hand sidebar. You'll see columns for log messages, timestamps (in your local time), instance name, integration name, and customer name.
Viewing logs for a specific customer
To view logs for a specific customer, select Customers in the sidebar, choose a customer, and click the Logs tab. You'll see columns for log messages, timestamps (in your local time), instance name, and integration name.
For more information, see Customers.
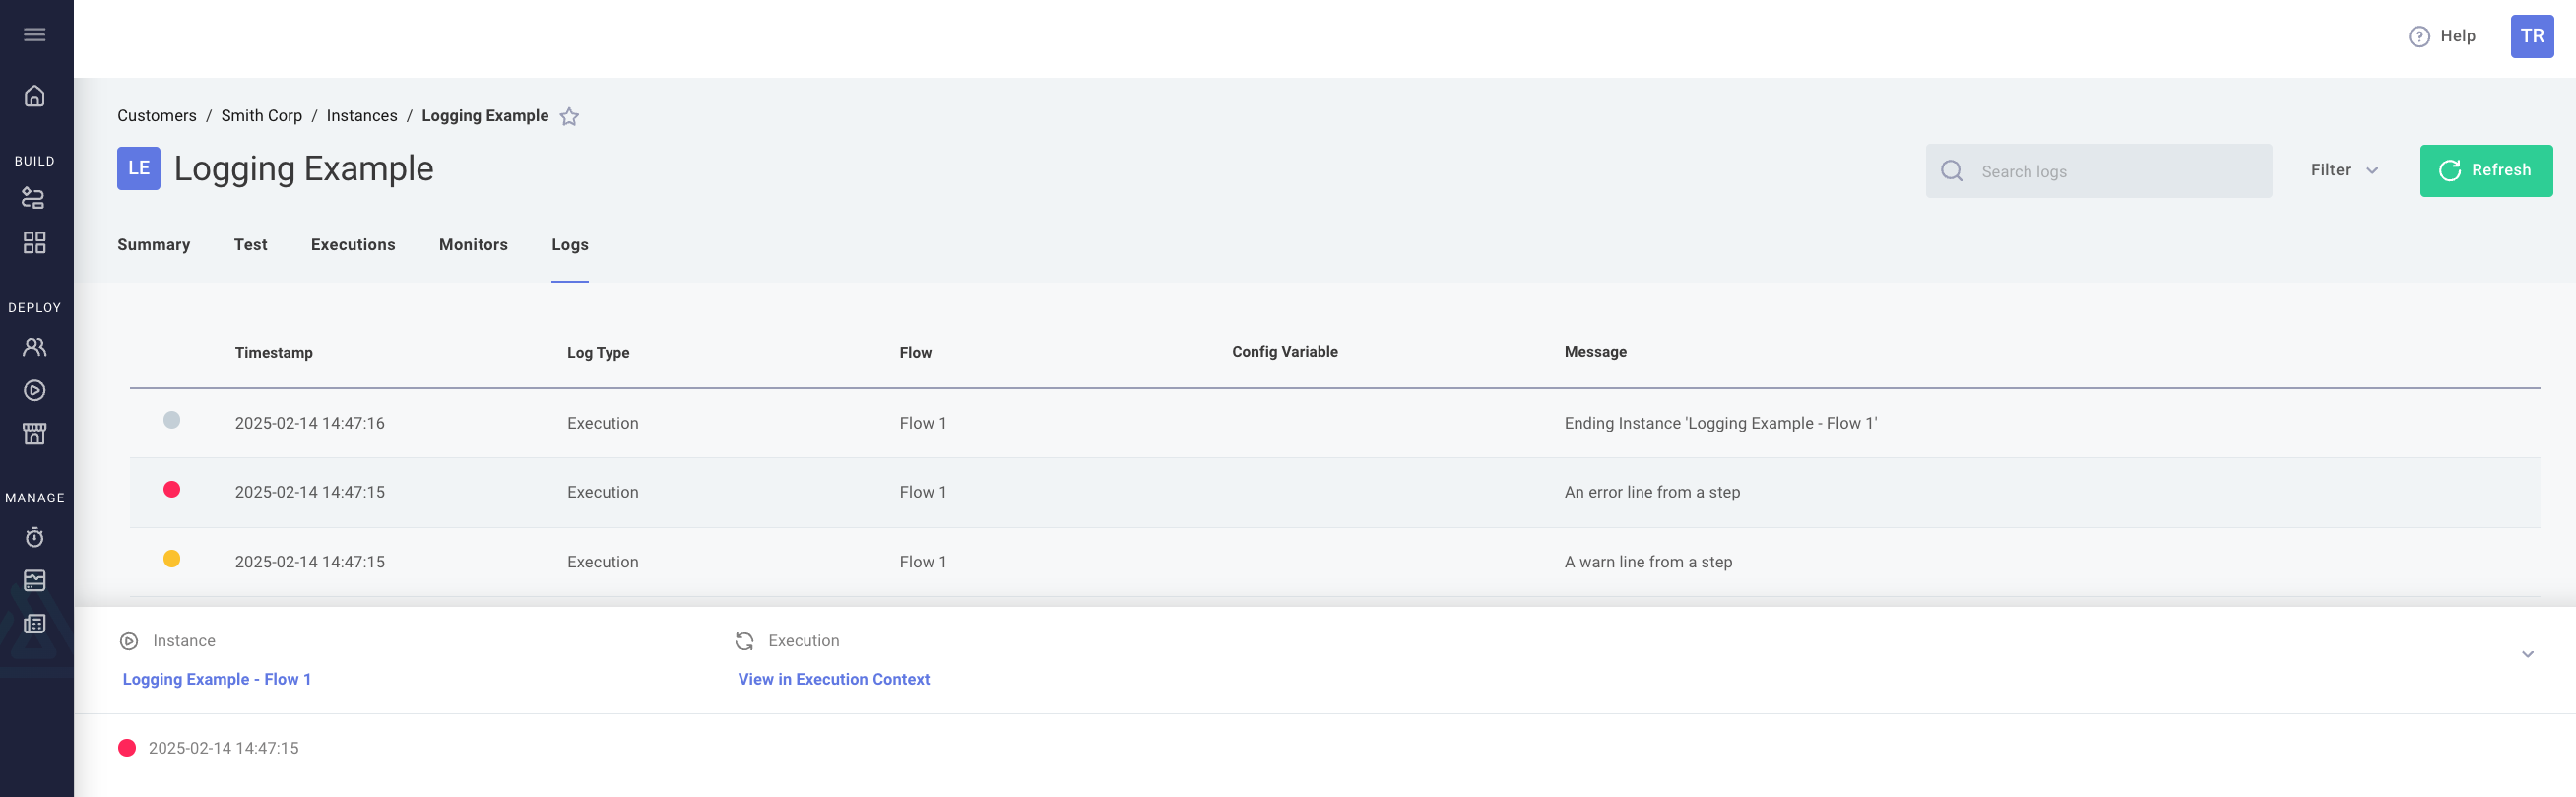
Viewing logs for a specific instance
To view logs for a specific instance:
- Click Instances in the sidebar and select an instance, or
- Click Customers, select a customer, and choose an instance under the Instances tab.
Once viewing an instance, select the Logs tab. You'll see columns for log messages, timestamps (in your local time), integration name, and customer name.
For more information, see Instances.
Searching and filtering logs
Search log messages using the Search Logs bar at the top of any log page.
For detailed information about a specific log entry, click the log line to display an information panel at the bottom of the screen.
Filter logs using the Filter dropdown to the right of the search bar. Filter by:
- Log Type (execution, connection, data source, or trigger logs)
- Time range
- Log Severity (Error, Warn, Info, Debug)
- Flow

Viewing connection logs
Connections generate logs during testing in the integration designer and when used in deployed instances. If a connection encounters an error (e.g., expired credentials), it is recorded in the connection's logs.
To view a connection's logs, click the log icon next to the connection.

Click any log line in the resulting popover to view more details.
Viewing data source config variable logs
Data sources fetch data from third-party APIs and present it in the config wizard. Data source logs are not tied to specific executions.
Organization users can view data source logs by clicking the log icon near the data source config variable. Note: This icon is not available to customer users configuring integrations in your embedded marketplace.

Data source logs are also available with their associated config variables in the Test Configuration drawer under Logs.

Viewing trigger lifecycle logs
Most trigger functions run as part of an execution - receiving a webhook request and returning a value, or running on a schedule.
Some trigger lifecycle functions (such as onInstanceDeploy and onInstanceDelete) execute when instances are created or deleted.
These function logs are available in the Test Configuration drawer under Logs.
What gets logged?
When a component calls context.logger.{debug,info,warn,error}(), the log entry is saved in Prismatic's logging system.
In addition to component-generated logs, the following standard log types are recorded:
| Type | Example | Purpose | Log Level |
|---|---|---|---|
| Instance Start | Starting Instance 'Sample Instance' | Marks the beginning of an instance run | info |
| Instance End | Ending Instance 'Sample Instance' | Indicates successful instance completion | info |
| Step Started | Fetch file from Dropbox | Shows the name of the step being executed | info |
| Step Failed | {{ ERROR MESSAGE }} | Indicates step failure with the associated error message | error |
For More Information:
context.logger
Log levels
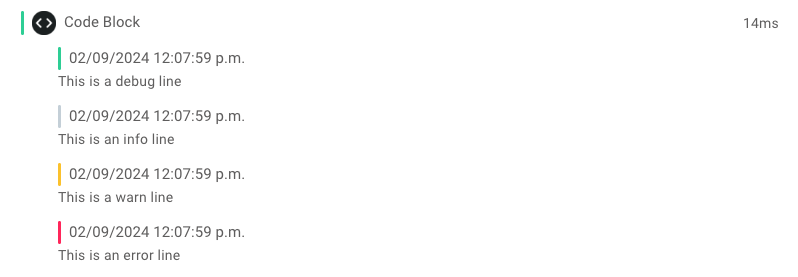
Prismatic uses four log levels: debug, info, warn, and error.
Each level is visually distinguished:
debug: green iconsinfo: gray iconswarn: yellow iconserror: red icons