Monitor Execution Load
The executions list shows what happened over a period of time. To see what's happening right now, filter the list to running or queued executions. Summary tiles then appear above the list, showing current running and queued counts, your remaining headroom under your organization's concurrent execution limit, and the instances and customers generating the most load.
Use the tiles to answer questions like:
- How close is my organization to its concurrent execution limit?
- Is a queue building up, and how long has the oldest queued execution been waiting?
- Which instance or customer is responsible for a spike in load?
Viewing execution load
Open any of these pages and select the Running or Queued status filter at the top of the page:
- The Executions page in the left-hand sidebar
- A customer's Executions tab
- An integration's Executions tab
- An instance's Executions tab
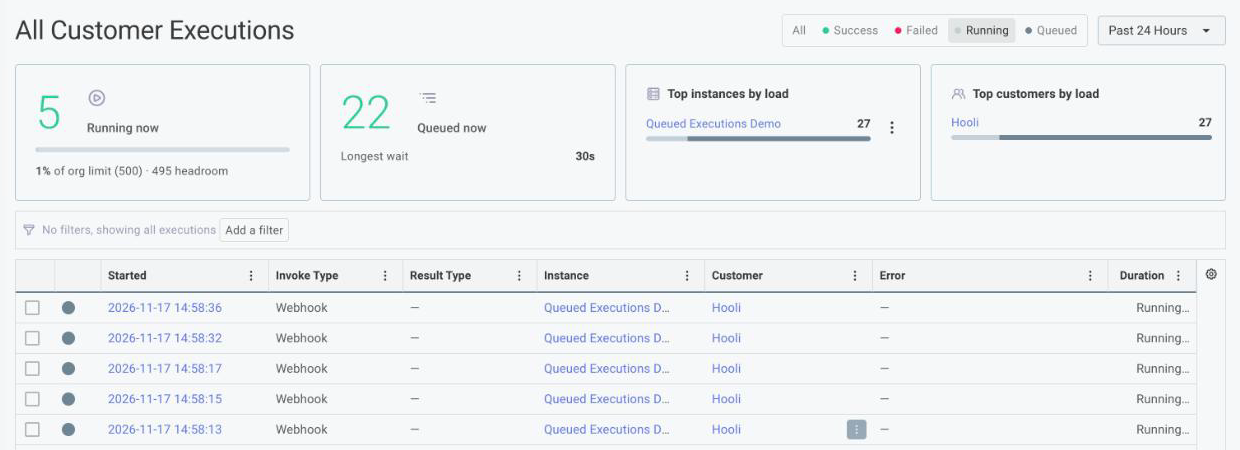
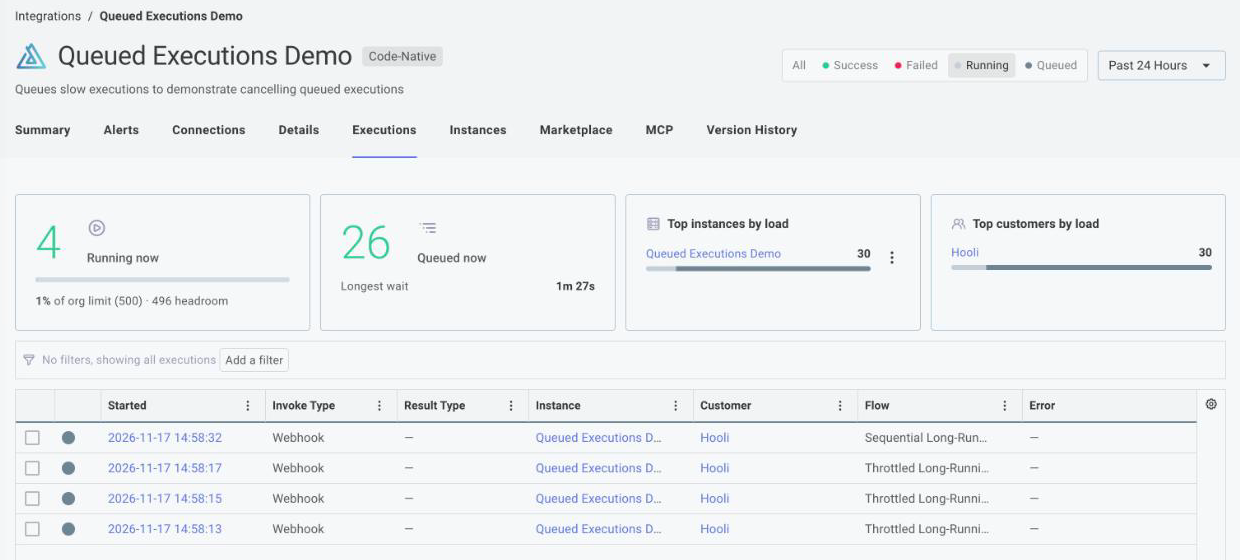
Each page shows the tiles that are useful at its scope:
| Page | Running now | Queued now | Top instances by load | Top customers by load |
|---|---|---|---|---|
| Executions (all) | ✓ | ✓ | ✓ | ✓ |
| Integration Executions tab | ✓ | ✓ | ✓ | ✓ |
| Customer Executions tab | ✓ | ✓ | ✓ | |
| Instance Executions tab | ✓ | ✓ |
On an integration's Executions tab, the tiles cover instances of every version of the integration. The tiles aren't available in the embedded marketplace.
Understanding the tiles
Running now
Running now shows the number of executions running at this moment.
Below the count, a bar and a line of text such as 1% of org limit (500) · 496 headroom compare that number to your organization's concurrent execution limit.
Headroom is the number of additional executions your organization can start before new requests receive a 429 "too many requests" response.
The comparison always uses your organization-wide limit, including on customer, integration, and instance pages. On those pages, the percentage tells you how much of the organization's capacity that customer, integration, or instance is using. The tiles don't show per-customer concurrency limits.
Queued now
Queued now shows the number of executions waiting in a queue because their flow uses throttled or FIFO concurrency. Longest wait shows how long the oldest queued execution has been waiting. A queue that keeps growing, or a longest wait that keeps increasing, means executions are arriving faster than the flow's concurrency limit lets them run.
Requests that exceed your organization's concurrent execution limit aren't queued; they're rejected, so they don't appear in this count.
If the queued executions shouldn't run, you can cancel them from the ⋮ menu on an instance's Queued now tile.
Top instances by load and top customers by load
These tiles list up to three instances or customers with the most running and queued executions combined. The number beside each name is that total. Its bar shows the split: the lighter segment is running executions and the darker segment is queued executions. Hover over a segment to see its count. The bars are scaled relative to the busiest entry in the tile, not to a limit.
Click a name to open that instance or customer. The ⋮ menu beside each instance offers two actions:
- Filter to this set filters the executions list to that instance so you can inspect its executions. It also sets the time range to the past two weeks.
- Cancel Queued Executions cancels the instance's queued executions. See Cancel Queued Executions.
How current the tiles are
The tiles always show the current state. They don't change when you select a different time range or add filters to the executions list; only the page you're on (organization, customer, integration, or instance) determines their scope.
The tiles refresh about every 10 seconds, and their data lags real time by a few seconds or more, so a burst of executions that starts and finishes quickly may not appear. Test executions from the integration designer are included.
The tiles show current load only. To be notified when your organization or a customer approaches its limit, create a Concurrency Threshold Warning or Customer Concurrency Threshold Warning alert monitor.
Fetching execution load from the API
The tiles are powered by the executionLoadKpis query.
Call it without arguments for your whole organization, or pass customerId, instanceId, or versionSequenceId to scope it:
query {
  executionLoadKpis(instanceId: "SW5zdGFuY2U6ZXhhbXBsZQ==") {
    runningCount
    queuedCount
    oldestQueuedAt
    topInstances {
      id
      name
      runningCount
      queuedCount
    }
    topCustomers {
      id
      name
      runningCount
      queuedCount
    }
  }
}
The query doesn't return your concurrent execution limit.
Fetch it from authenticatedUser { org { concurrentExecutionLimit } }.