Instance Executions
When you trigger a flow, it creates an execution. An execution represents a single run of a flow.
Executions can be triggered by multiple event types:
- Scheduled runs via schedule triggers
- Webhook invocations (webhook triggers)
- Instance deployment or removal events (deployment triggers)
You can trigger a flow within an instance concurrently, resulting in multiple simultaneous executions.
Flows can also invoke other flows within the same instance by calling sibling flows' webhook URLs. Each invocation is a distinct execution.
If an execution fails, or if you need to re-run an execution, you can replay previous executions.
Viewing execution step results
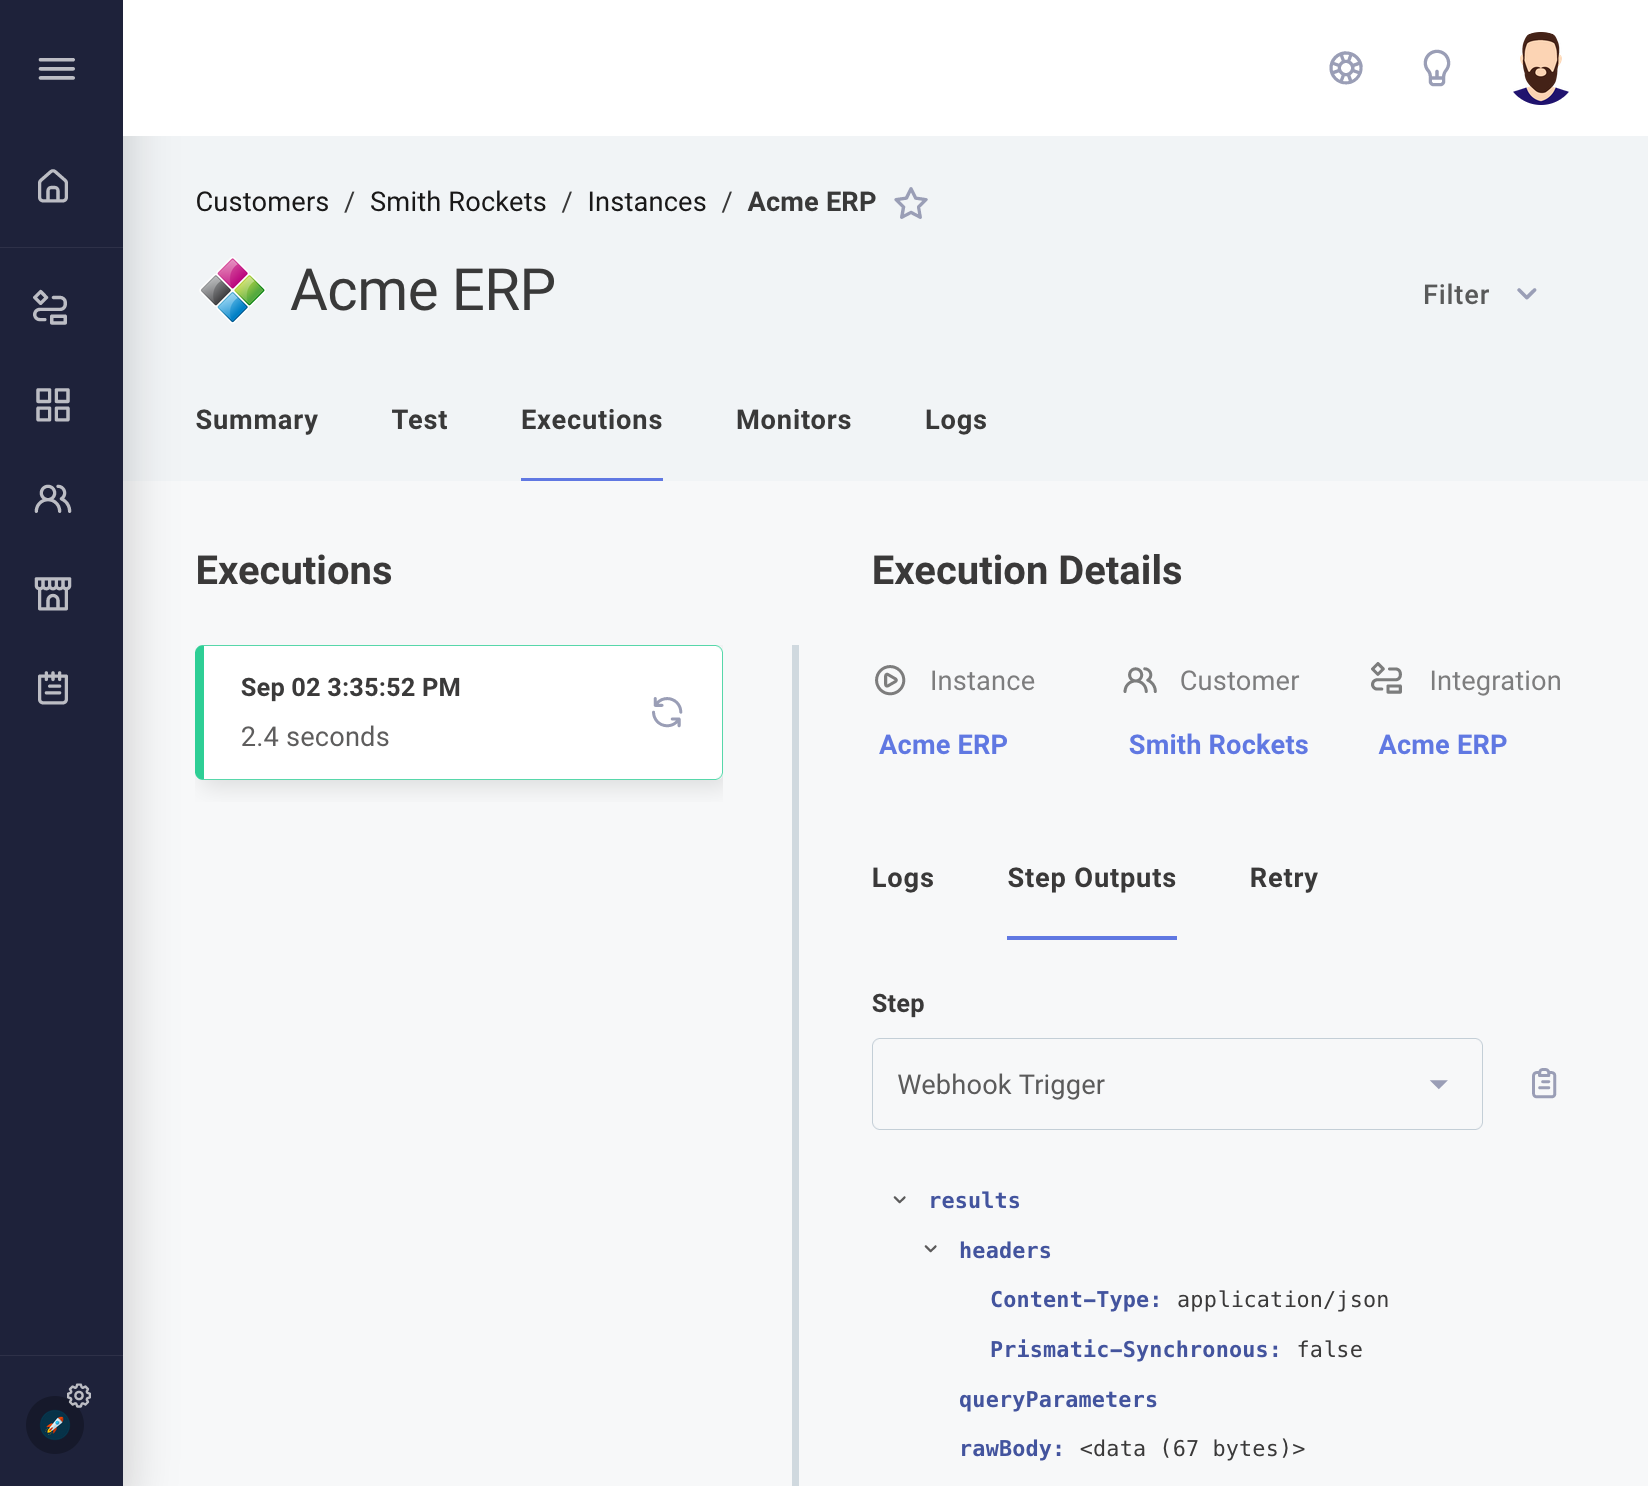
For debugging and analysis, you can review the results of instance executions. Navigate to the Executions tab on an instance's page to view logs and step outputs for each execution. Alternatively, view executions for all instances by selecting Executions from the left-hand sidebar.

If an instance fails to complete successfully, you can inspect the input data provided at invocation to assist with debugging.
You can access execution results for all instances and customers via the Executions link in the sidebar. For a specific customer, navigate to their Executions tab.
Fetching step results from the API
You can access step results via the Prismatic GraphQL API using the executionResult query.
Prismatic serializes results with MessagePack, which you can deserialize using the MessagePack library for your preferred language.
For more information: Fetching and Unpacking Step Results
Viewing execution logs
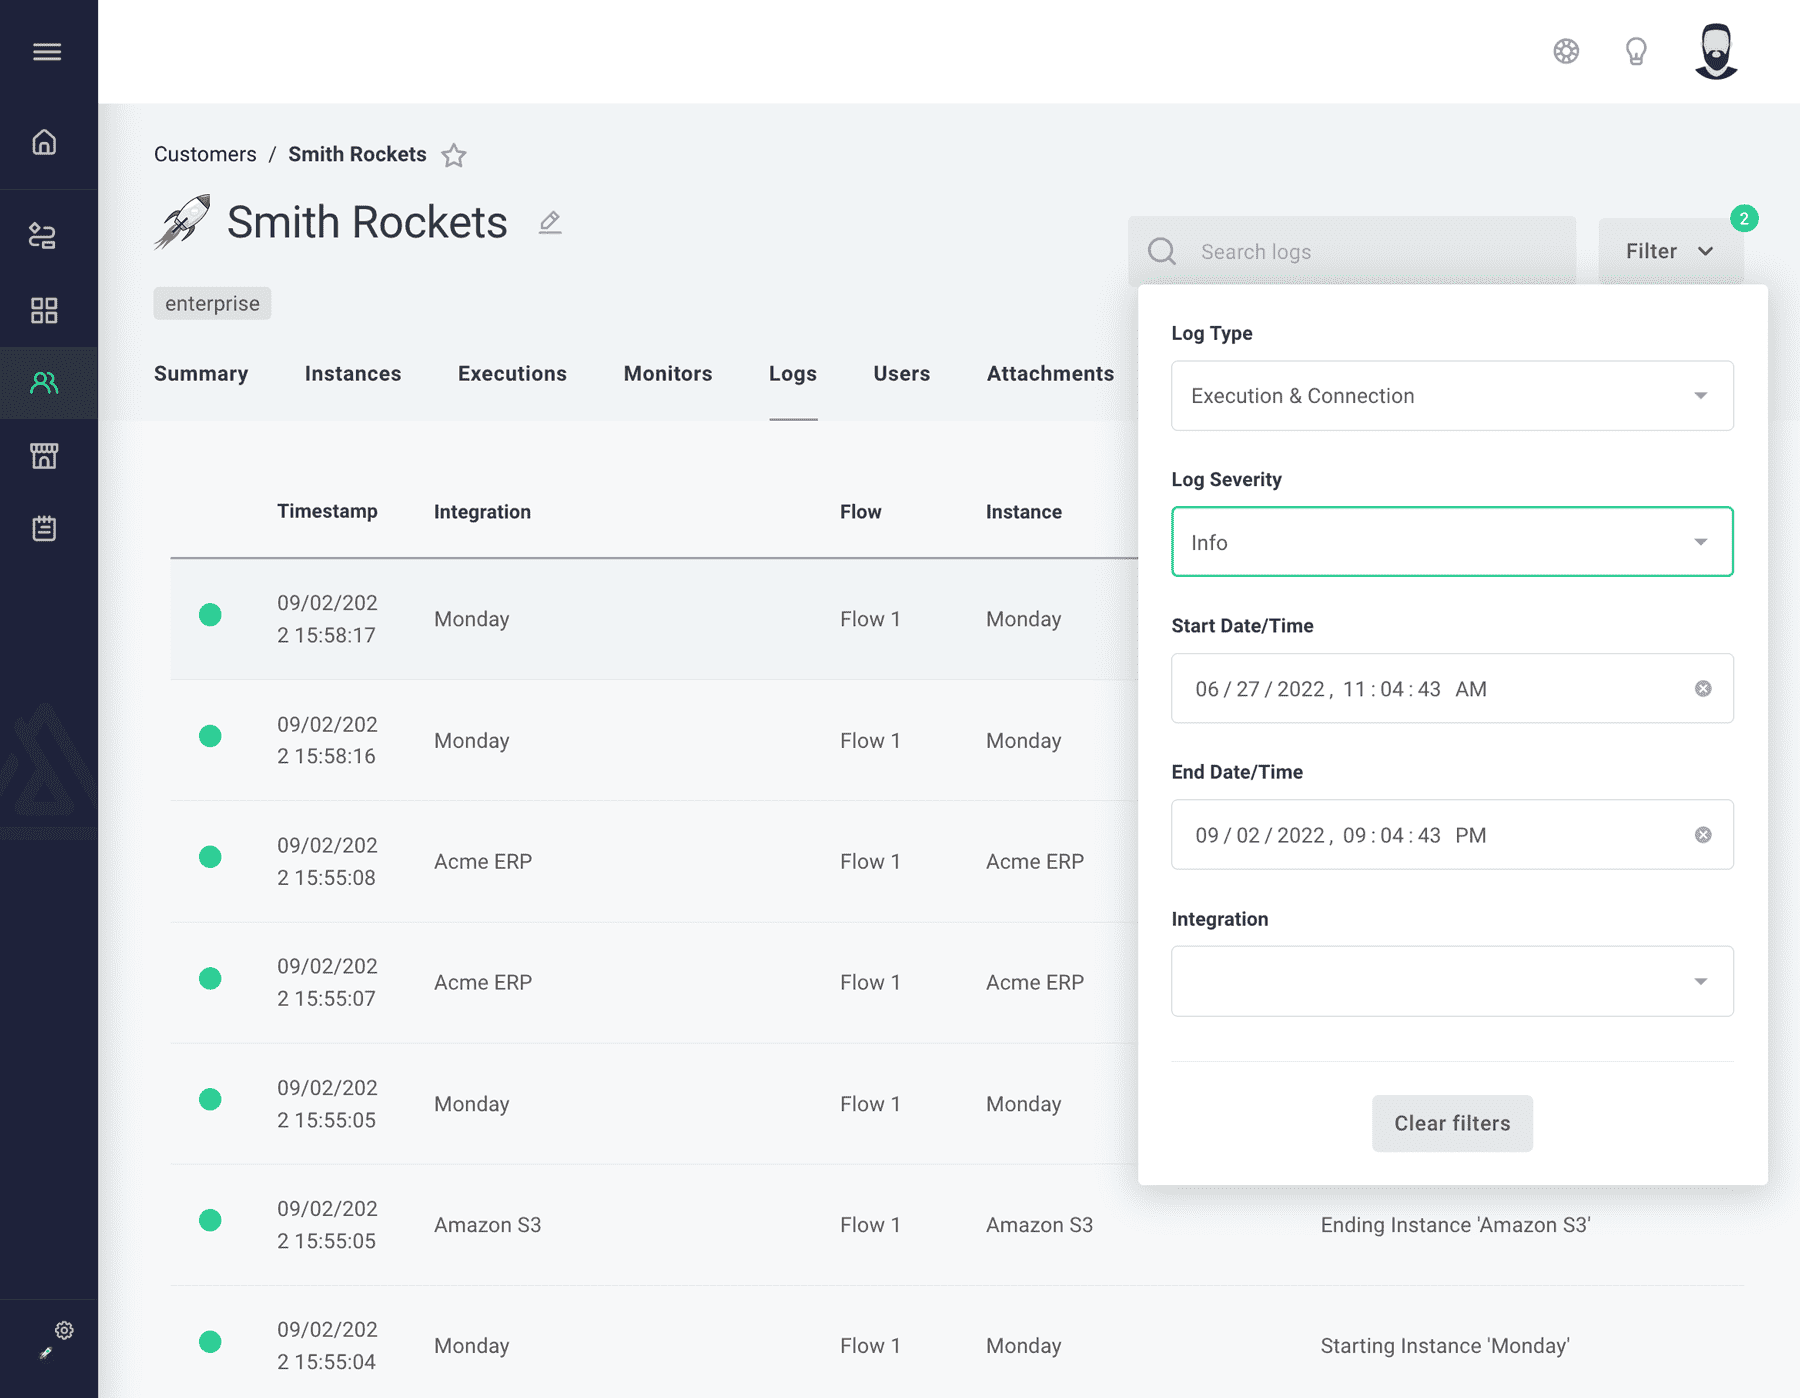
You can access instance logs from the Logs tab on the instance's page. You can also view logs for all instances via the Logs link in the sidebar, or for a specific customer by selecting their Logs tab.
Use the Search Logs bar at the top of the page to search log messages. Filter logs by severity or date range using the Filter link to the right of the search bar.

For more information, see Logging.