Alert Monitors
Alert triggers
You can configure your alert monitors to respond to many different events:
- Execution Completed: Triggers when an instance runs successfully
- Use case: Notify customers of successful integration runs
- Execution Duration Matched or Exceeded: Triggers when execution time exceeds a specified threshold
- Example: Alert if an integration takes longer than 10 seconds when it typically takes 5
- Execution Failed: Triggers on instance execution failure
- Execution Failed, Retry Pending: Triggers when an execution fails but is scheduled for retry
- Execution Overdue: Triggers when an expected execution hasn't occurred within the specified interval
- Execution Started: Triggers when an instance begins execution
- Instance Disabled: Triggers when an instance is deactivated
- Instance Enabled: Triggers when an instance becomes active
- Use case: Notify project managers when an instance is ready for customer use
- Instance Removed: Triggers when an instance is deleted
- Log Level Matched or Exceeded: Triggers when logs meet or exceed specified severity levels
- Monitors unexpected
errororwarnlog entries
- Monitors unexpected
- Connection Threw an Exception: Triggers on connection failures
- Indicates expired credentials, invalid authentication, or API availability issues
Note: Some triggers are instance-wide (like status changes), while others are flow-specific (like execution events). This allows you to configure monitoring at the granular level through alert monitors.
For More Information: Log Levels
Alert monitors
An alert monitor is a combination of an alert group (users and webhooks) and an alert trigger that is configured for an instance. When you add an alert monitor to an instance, you specify when it should trigger and which alert group(s) to notify when a trigger fires.
Note that if your instances are configured to use a shared endpoint and a preprocess flow, an alert monitor cannot be assigned to the preprocess flow since the preprocess flow runs independently of any deployed instance.
Creating an alert monitor
- Web App
- CLI
- API
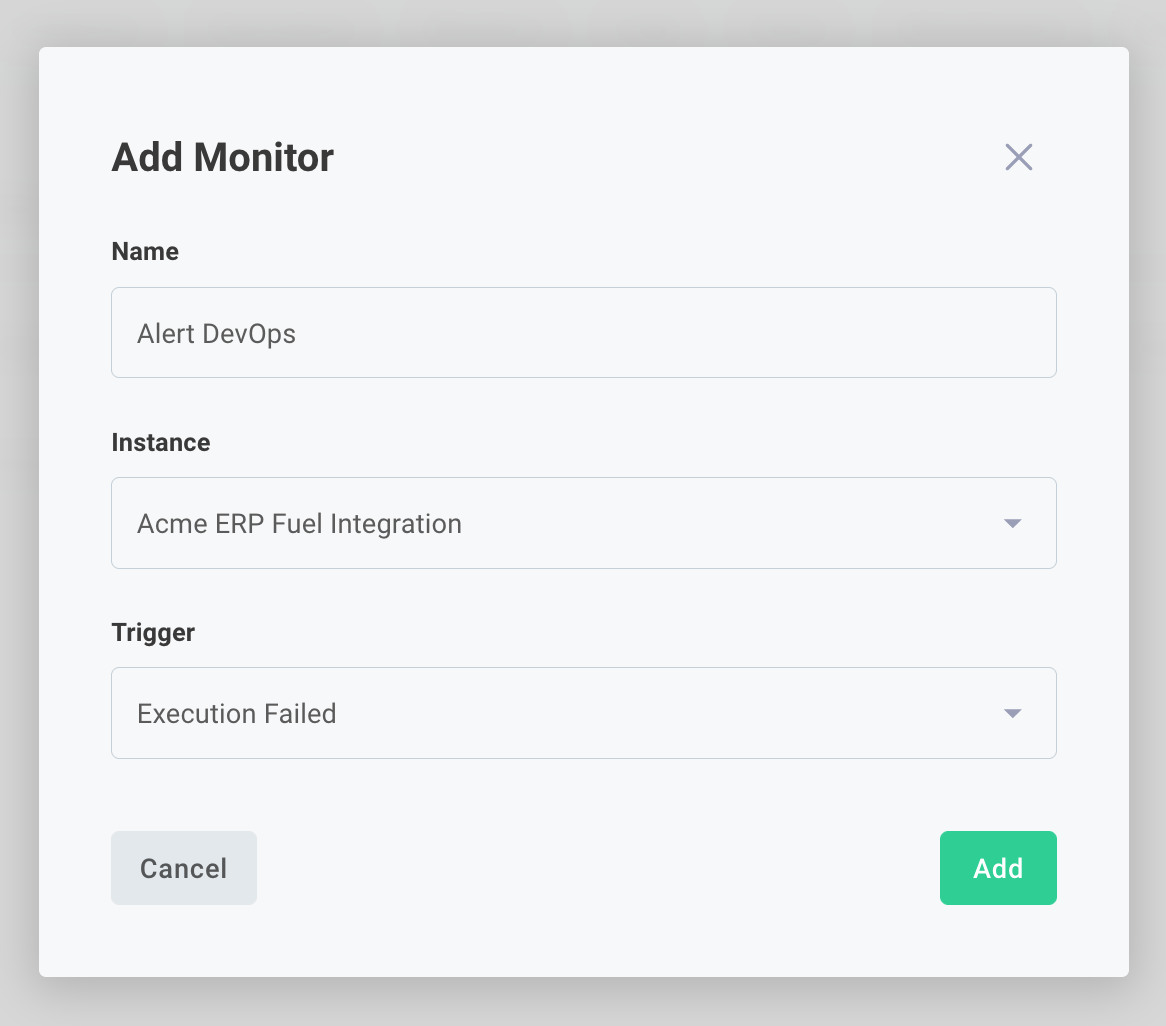
After selecting an instance from a customer's Instances tab or the Instances link on the left-hand sidebar, click the instance's Monitors tab. Click the + Add alert monitor button on the top-right of the screen. Specify a name for the monitor and select a trigger. If you're in a customer's Instances tab, you'll also need to specify the instance.
After creating the alert monitor, you'll land in the monitor's Details tab. Within this tab, you can add additional triggers to your alert monitor within the Triggers card. You can also choose the groups or users to notify and webhooks to trigger when an alert trigger fires.

To create an alert monitor, gather the IDs of the trigger you want, the instance, and the group(s) to alert. Then, you can create a monitor using that trigger ID, instance ID, and group ID(s).
# Get Trigger ID
prism alerts:triggers:list --extended --filter 'name=^Execution Failed$'

 Id                                                                   Name
 ──────────────────────────────────────────────────────────────────── ────────────────
 QWxlcnRUcmlnZ2VyOjQyYmM2MDY5LTE5YTktNDE1MS04ZjAwLTQ4ZWExN2E3MzZjMQ== Execution Failed

# Get Alert Group ID
prism alerts:groups:list --extended --filter 'name=^DevOps$'

 Id                                                               Name
 ──────────────────────────────────────────────────────────────── ──────
 QWxlcnRHcm91cDplMzcwMzY2OC0yZWM4LTQ0MWEtODdlYS02OGZjYTg1N2U5N2E= DevOps

INSTANCE_ID=$(prism instances:list --columns id --filter 'name=^Fabricate 3D Model for FTL Rockets$' --no-header)

prism alerts:monitors:create \
  --groups "[\"QWxlcnRHcm91cDplMzcwMzY2OC0yZWM4LTQ0MWEtODdlYS02OGZjYTg1N2U5N2E=\"]" \
  --name 'Alert Devops on Failure' \
  --instance ${INSTANCE_ID} \
  --triggers "[\"QWxlcnRUcmlnZ2VyOjQyYmM2MDY5LTE5YTktNDE1MS04ZjAwLTQ4ZWExN2E3MzZjMQ==\"]"
To create an alert monitor for an instance, query for alertTriggers) and select which types of triggers should result in an alert:
query listTriggers {
  alertTriggers {
    nodes {
      id
      name
    }
  }
}
You'll also need the IDs of the instance, users, and groups to notify. Then, use the createAlertMonitor) mutation to create the alert monitor:
mutation (
  $name: String!
  $instance: ID!
  $triggers: [ID]!
  $groups: [ID]
  $users: [ID]
) {
  createAlertMonitor(
    input: {
      name: $name
      instance: $instance
      triggers: $triggers
      groups: $groups
      users: $users
    }
  ) {
    alertMonitor {
      id
    }
  }
}
{
  "name": "Alert Alex and DevOps on Execution Failure",
  "instance": "SW5zdGFuY2U6OTc1YzgyMTEtYTIxZi00OTg1LThhODYtMTUxMTczM2ZiYTJh",
  "triggers": [
    "QWxlcnRUcmlnZ2VyOjhiOTg3YmYxLTk4YmMtNDViNy1hZDFkLTEwNWY0YTExZjdlOA==",
    "QWxlcnRUcmlnZ2VyOjdlOWEzMDA2LTQxODItNDQ0MC1iYzE2LTFiNjNjMzI2NzkwZA=="
  ],
  "groups": ["QWxlcnRHcm91cDo5MDQyYmM1ZC1hYTU5LTQ3Y2EtOWE4NC00NWIxNDBmZjYzYmQ"],
  "users": ["VXNlcjo4MzBjZTZmYS1iNDFlLTQ2MTQtODgzNi04NjA1MTcyY2IyOTc="]
}
Alerting on connection errors
You can set up an alert monitor to notify you when a connection expires or becomes invalid (for example, if credentials have been revoked or an API is down). To alert on connection errors, create a new alert monitor and select Connection Threw an Exception as the trigger.
This is especially useful with OAuth 2.0 connections. If refreshing your access key fails, the alert message will direct you straight to the relevant logs.
Editing existing alert monitors
To modify an existing alert monitor, click Instances on the left-hand sidebar and then select an instance. Under the instance's Monitors tab, select a monitor. This brings you to the same screen you saw when creating the monitor, where you can modify notification settings under the Details tab.
Deleting an alert monitor
- Web App
- CLI
- API
Click Customers from the left-hand sidebar and select a customer. Under the customer's Instances tab, select an instance and then click Monitors. Click into an alert monitor and open the Details tab. Scroll to the bottom of the page. Click Delete Monitor and confirm deletion by clicking Remove monitor
Find the ID of the alert monitor you would like to delete using
prism alerts:monitors:list --extended
and then delete the monitor with
prism alerts:monitors:delete ${ALERT_MONITOR_ID}
Delete an alert monitor with the deleteAlertMonitor) mutation:
mutation {
  deleteAlertMonitor(
    input: {
      id: "QWxlcnRNb25pdG9yOjQ4ZjVkZjkzLWU3MTAtNGFmNi1iZmRmLWU5ZWM4MDAzYTAyOA=="
    }
  ) {
    alertMonitor {
      id
    }
  }
}