Troubleshooting and Debugging Integrations
Debug mode
Debug mode can be enabled in the integration designer or for a specific instance.
When debug mode is enabled, two things happen:
- After each step runs, a log is emitted detailing how long the step took to run and how much memory was consumed.
- Each code step and component is provided a
debugobject, which you can use to emit additional debug logs or measure memory or time performance of your code.
Note that debug mode generates additional logs and performance metrics and can cause performance issues when left on. Please use debug mode selectively and deactivate it on instances when you are not actively debugging production issues.
Enabling debug mode in the integration designer
To enable debug mode in the integration designer, click the gray Debug Mode button on the right side of the test runner drawer. Then, confirm that you truly want to enable debug mode (as logs can be verbose and can cause performance issues).
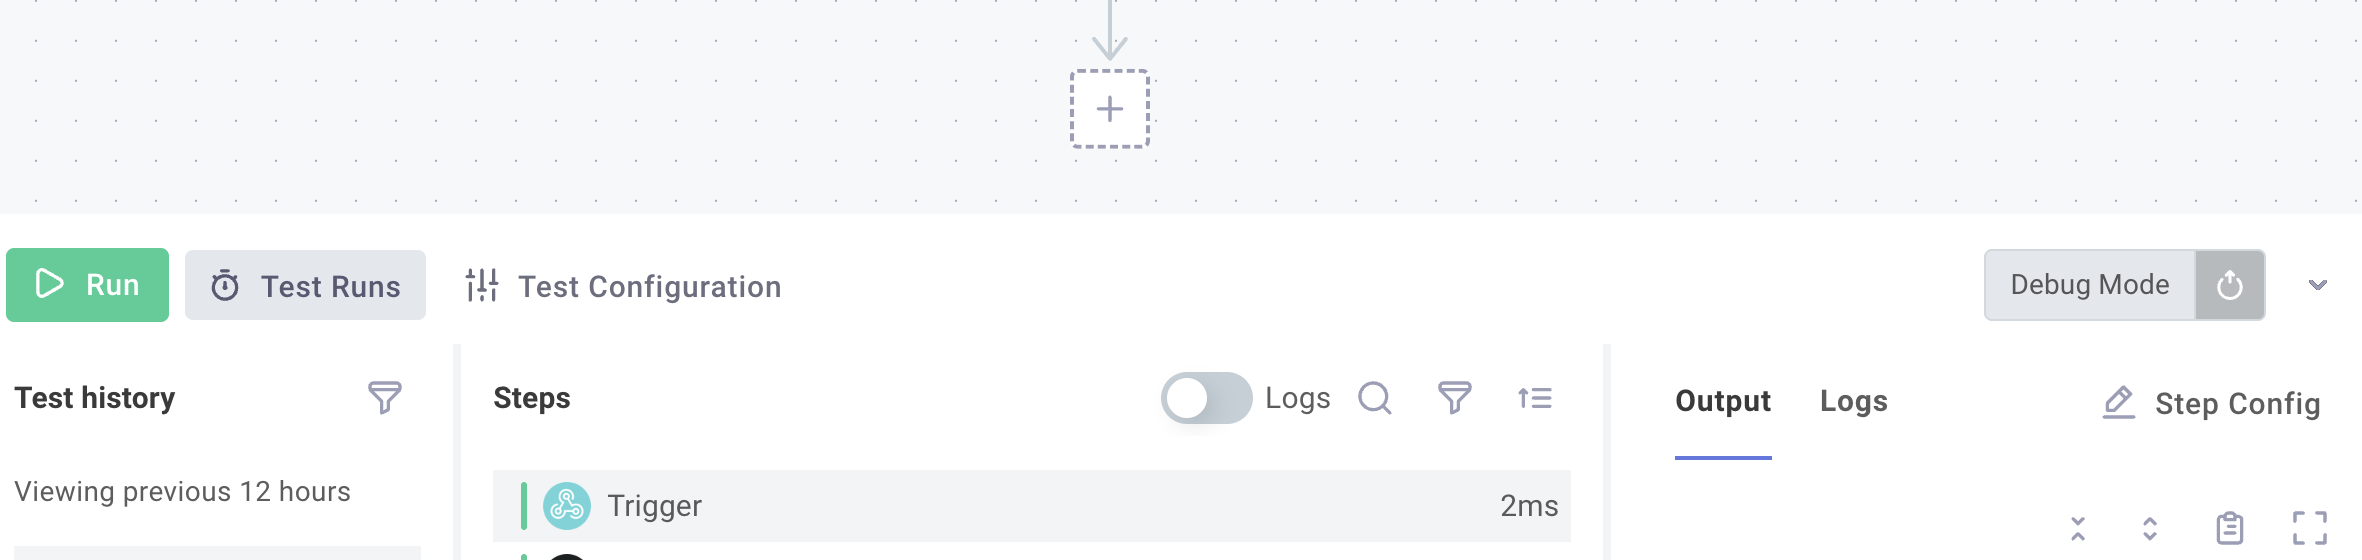
To disable debug mode, click the same (now yellow) button again.
Enabling debug mode for an instance
To enable debug mode for a specific instance, open the instance's Summary tab and select Disabled under Debug Mode.

To disable debug mode on an instance, click the same (now yellow) Enabled button again.
Debug mode logs
When debug mode is enabled, a log line will be emitted after each step that looks like this:
{
  "stepName": "codeBlock",
  "memoryUsage": {
    "rss": 381.484375,
    "heapTotal": 58.97265625,
    "heapUsed": 53.90106964111328,
    "external": 258.9808874130249,
    "arrayBuffers": 0.14438152313232422
  },
  "duration": 3.401575000025332,
  "platform": true
}
Within the log line are two useful metrics:
durationindicates the number of milliseconds that the step took to run.memoryUsageindicates how much memory was used when this step completed. Therssvalue is the most important metric - it represents the total amount of memory (in MB) that the runner was using. The other values are outlined here. Note that unlike NodeJS documentation (which displays memory values in bytes), the log line presents MB for readability.
Running steps conditionally based on debug mode
A flow's trigger returns, among other things, the value of globalDebug.
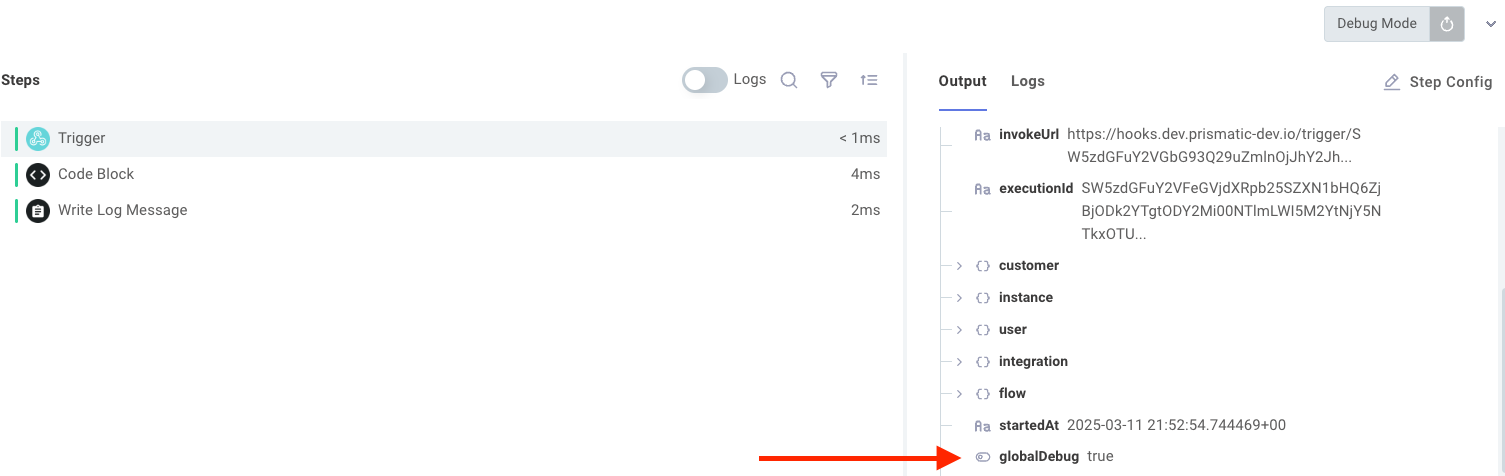
You can reference that value in a branch step to determine which branch to follow.
Using debug mode in a code block or custom connector
The context parameter passed to a custom connector's actions and triggers contains an object, debug, which can be used to write additional debug logging or measure memory or time performance of specific parts of your code.
Checking if debug mode is enabled in a code block or custom connector
The context parameter's debug.enabled property will be true if debug mode is enabled, and false otherwise.
module.exports = async (context, stepResults) => {
  const widgetId = stepResults.getWidget.results.id;

  if (context.debug.enabled) {
    context.logger.log(`Got widget ID "${widgetId}"`);
  }

  // ...
};
Similar concepts can be applied to custom connector code or code-native integrations using their context parameters.
Measuring time performance in a code block or custom connector
If a code block or custom action is running slowly, you can book-end a portion of potentially "slow" code with context.debug.timeElapsed.mark functions to note when the "slow" code started and finished.
The context.debug.timeElapsed.measure function can then be used to determine the time between start and finish, giving you performance metrics for each portion of your code.
async function sleep(ms) {
  return new Promise((resolve) => setTimeout(resolve, ms));
}

const mySlowFunction = async () => sleep(2000);
const mySlowerFunction = async () => sleep(5000);

module.exports = async (context, stepResults) => {
  context.debug.timeElapsed.mark(context, "slowCode1_start");
  await mySlowFunction(); // A "long-running" process that takes about 2 seconds
  context.debug.timeElapsed.mark(context, "slowCode1_end");
  context.debug.timeElapsed.measure(context, "longRunning1", {
    start: "slowCode1_start",
    end: "slowCode1_end",
  });

  context.debug.timeElapsed.mark(context, "slowCode2_start");
  await mySlowerFunction(); // A "long-running" process that takes about 5 seconds
  context.debug.timeElapsed.mark(context, "slowCode2_end");
  context.debug.timeElapsed.measure(context, "longRunning2", {
    start: "slowCode2_start",
    end: "slowCode2_end",
  });

  return { data: null };
};
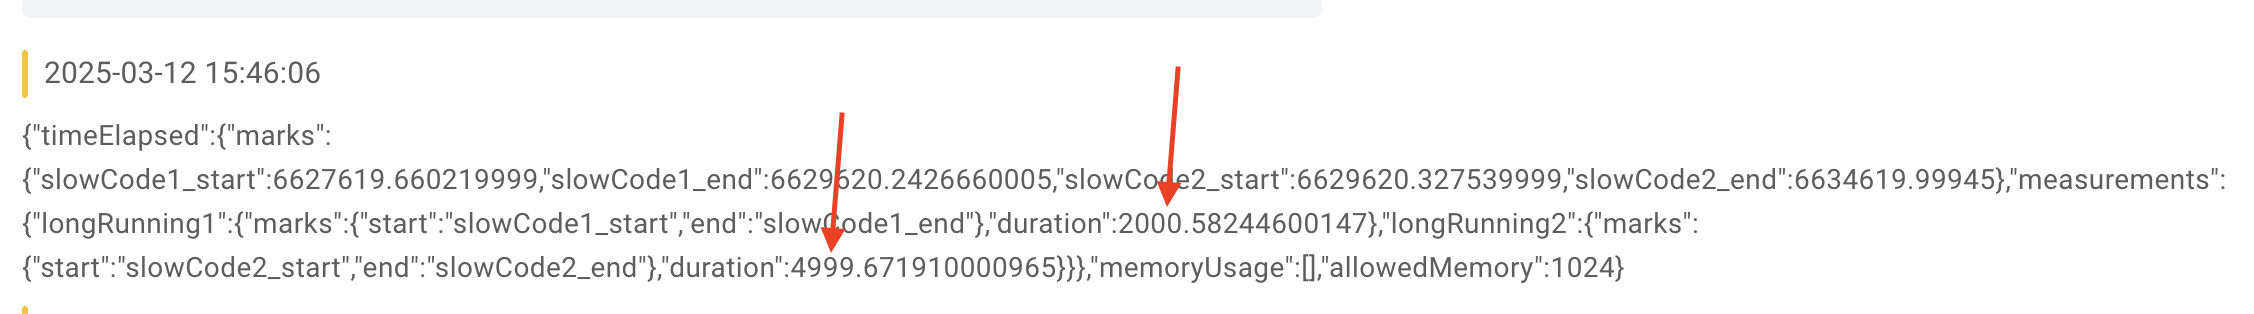
Note that in the above code, two functions book-ended with mark functions take about 2000 and 5000ms to run respectively.
We can find these durations in our instance's logs:
Measuring memory performance in a code block or custom connector
At any point in your code block or custom action or trigger, you can invoke context.debug.memoryUsage, which will take a snapshot of memory usage at a specific time.
Here, we determine how much memory was used before and after fetching data from an API:
module.exports = async (context, stepResults) => {
  context.debug.memoryUsage(context, "Before Fetching Data");

  const response = await fetch("https://jsonplaceholder.typicode.com/todos");
  const todoItems = await response.json();

  context.debug.memoryUsage(context, "After Fetching Data");

  return { data: todoItems };
};
Memory usage (rss) represents the total amount of memory consumed by the execution in MB.
Here, we can see that fetching data consumed about 10MB of memory.

Common error messages
This section outlines common error messages that you may see and how to fix them.
P10001: Result too large to serialize
You may see this error when dealing with large files (greater than 128MB) due to limitations on how large a JavaScript Buffer can be.
Reduce the size of your step result if possible.
Consider processing files using streams.
P10002: Result contains non-serializable functions
You may see this error if your step result contains JavaScript functions.
Prismatic serializes step results using MessagePack.
JavaScript functions are non-serializable.
So, you cannot return { data: { foo: () => "myReturnValue" } }, for example.
As a work-around, you can JSON stringify and JSON parse an object, and functions will be automatically removed.
const myReturnValue = {
  foo: 123,
  bar: "Hello, World",
  baz: () => {
    console.log("Hi!");
  },
};
const sanitizedResults = JSON.parse(JSON.stringify(myReturnValue));
return { data: sanitizedResults }; // Returns {foo: 123, bar: "Hello, World"}
P10003: Error serializing step results
An unknown error occurred when serializing your step results. Prismatic serializes step results using MessagePack. MessagePack supports a number of complex and primitive types (numbers, strings, objects, arrays, Buffers, null, etc.). Ensure that the data you are returning is included in the MessagePack spec.