Memory Management
By default, the integration runner is allocated 1024 MB (1 GB) of memory. This is sufficient memory to complete most common integration tasks.
This article covers common memory issues (and how to avoid them).
Common out-of-memory scenarios
There are a few common situations where you may run out of memory and encounter an error stating Execution has exceeded the maximum allowed memory.
Loading large files into memory
Suppose that your integration needs to pull down a CSV file from an SFTP server, deserialize the file into a JavaScript object, and perform some task on each record. If your file is large (say, 80MB in size) and you use several steps to accomplish your goal, you can end up using well over 1 GB of memory:
- The SFTP step will use at least 160MB when downloading the file, as it fetches the file contents as a Buffer and converts that to a string.
- The SFTP step will use at least 80MB when serializing and persisting the step result.
- The step that deserializes the CSV string to a JavaScript object will (in our experience) use 12 times the size of the file in memory. So, this step will likely consume around 960MB of memory!
It's easy to see how you could run out of memory quickly.
When you process large files, you may benefit from writing a custom action that processes data in a Node.js stream. This way, you load smaller portions of the large file into memory at a time, processing and then discarding each portion. See Handling Large Files in Custom Components for examples of how to process large files as streams.
Excessive logging
The runner's logger service writes logs asynchronously to ensure that your flows are not slowed down by logs. If you log thousands of debug lines in a step, the logger service will use a large amount of memory to serialize and commit each of those lines.
Try to avoid placing log lines in a loop that iterates thousands of times.
Ending a loop with a large step result
If you have a set of steps in a loop and the final step returns large step results, the loop step itself may cause an out-of-memory error. This is because the loop step returns an array containing the result of the last step of the loop from each iteration.
For example, suppose you have a loop with three steps, and the final step returns a result that is 50 KB. If the loop iterates 10,000 times, then the loop step will return an array that is 50 KB x 10000 = 500MB.
Add a no-op code step that returns { data: null } at the end of your loop to avoid high-memory-usage loop steps.
Displaying memory usage
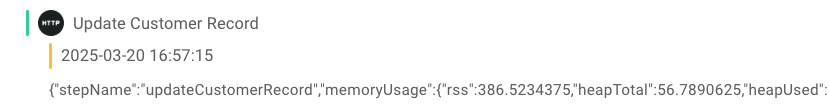
If you'd like to see how much memory is used by each step of your flow, you can enable debug mode.
After each step, you'll see a log line that displays memory usage.
memoryUsage.rss represents the total memory used by the flow (in megabytes).
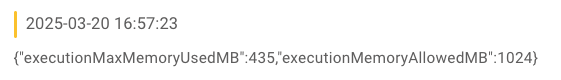
Additionally, when your execution completes, you will see the maximum amount of memory used by your flow in your execution's logs.
If you would like to profile a single custom code or custom connector step within your integration to determine which portion of your code consumes memory, you can use the debug.memoryUsage.
Configuring memory limits
By default, the integration runner runs with 1GB of memory. If you continue to encounter memory constraints and have already implemented the above strategies, please contact your Prismatic account manager. We can work out a proposal to allocate additional memory to some instances using instance profiles.