Managing Instances
Enabling and disabling instances
If you would like to stop a deployed instance from executing, click the Enabled button under Status on the instance's Summary tab. When disabled, your instance will not execute on a cron schedule (if configured to use scheduled triggers), nor respond to webhook invocations.
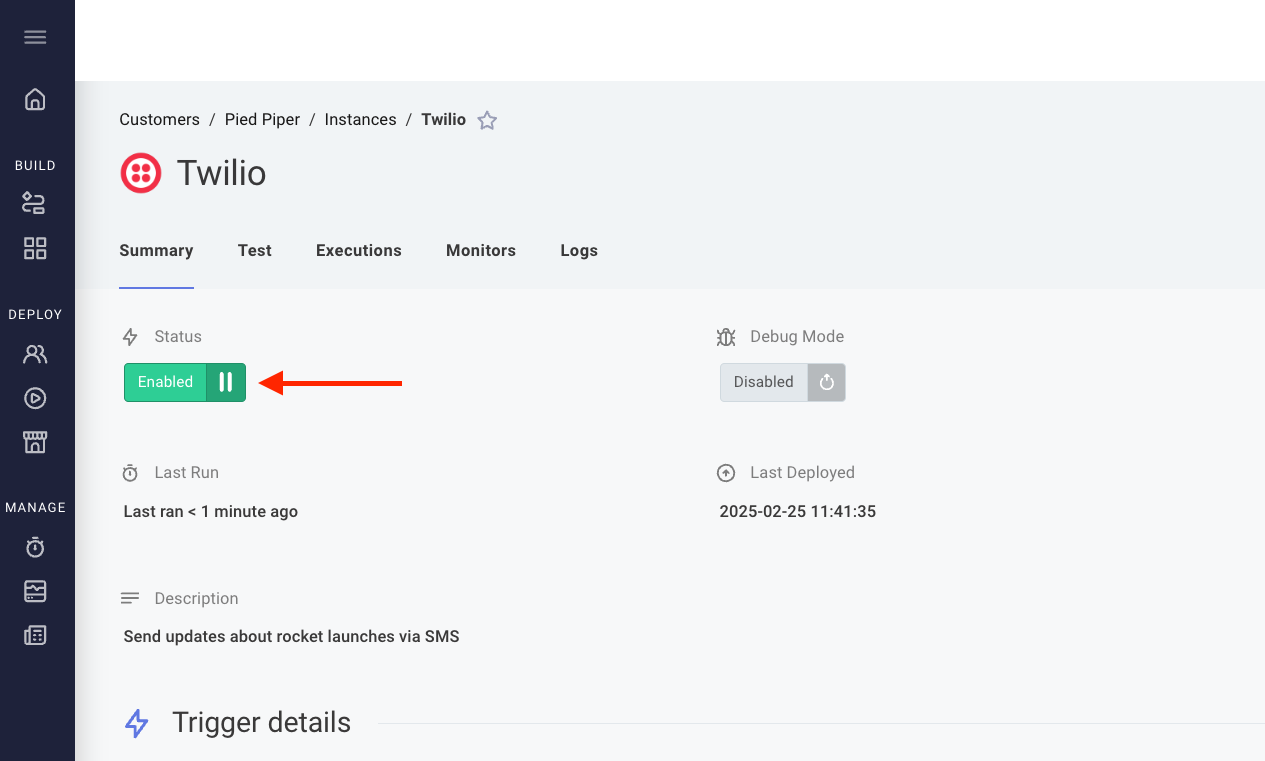
To re-enable a disabled instance, click the yellow Paused button.
Viewing instance execution results
It's useful for debugging purposes to be able to see execution results of instance invocations. Click the Executions tab from an instance's page to see the logs and step outputs of each execution of the instance.
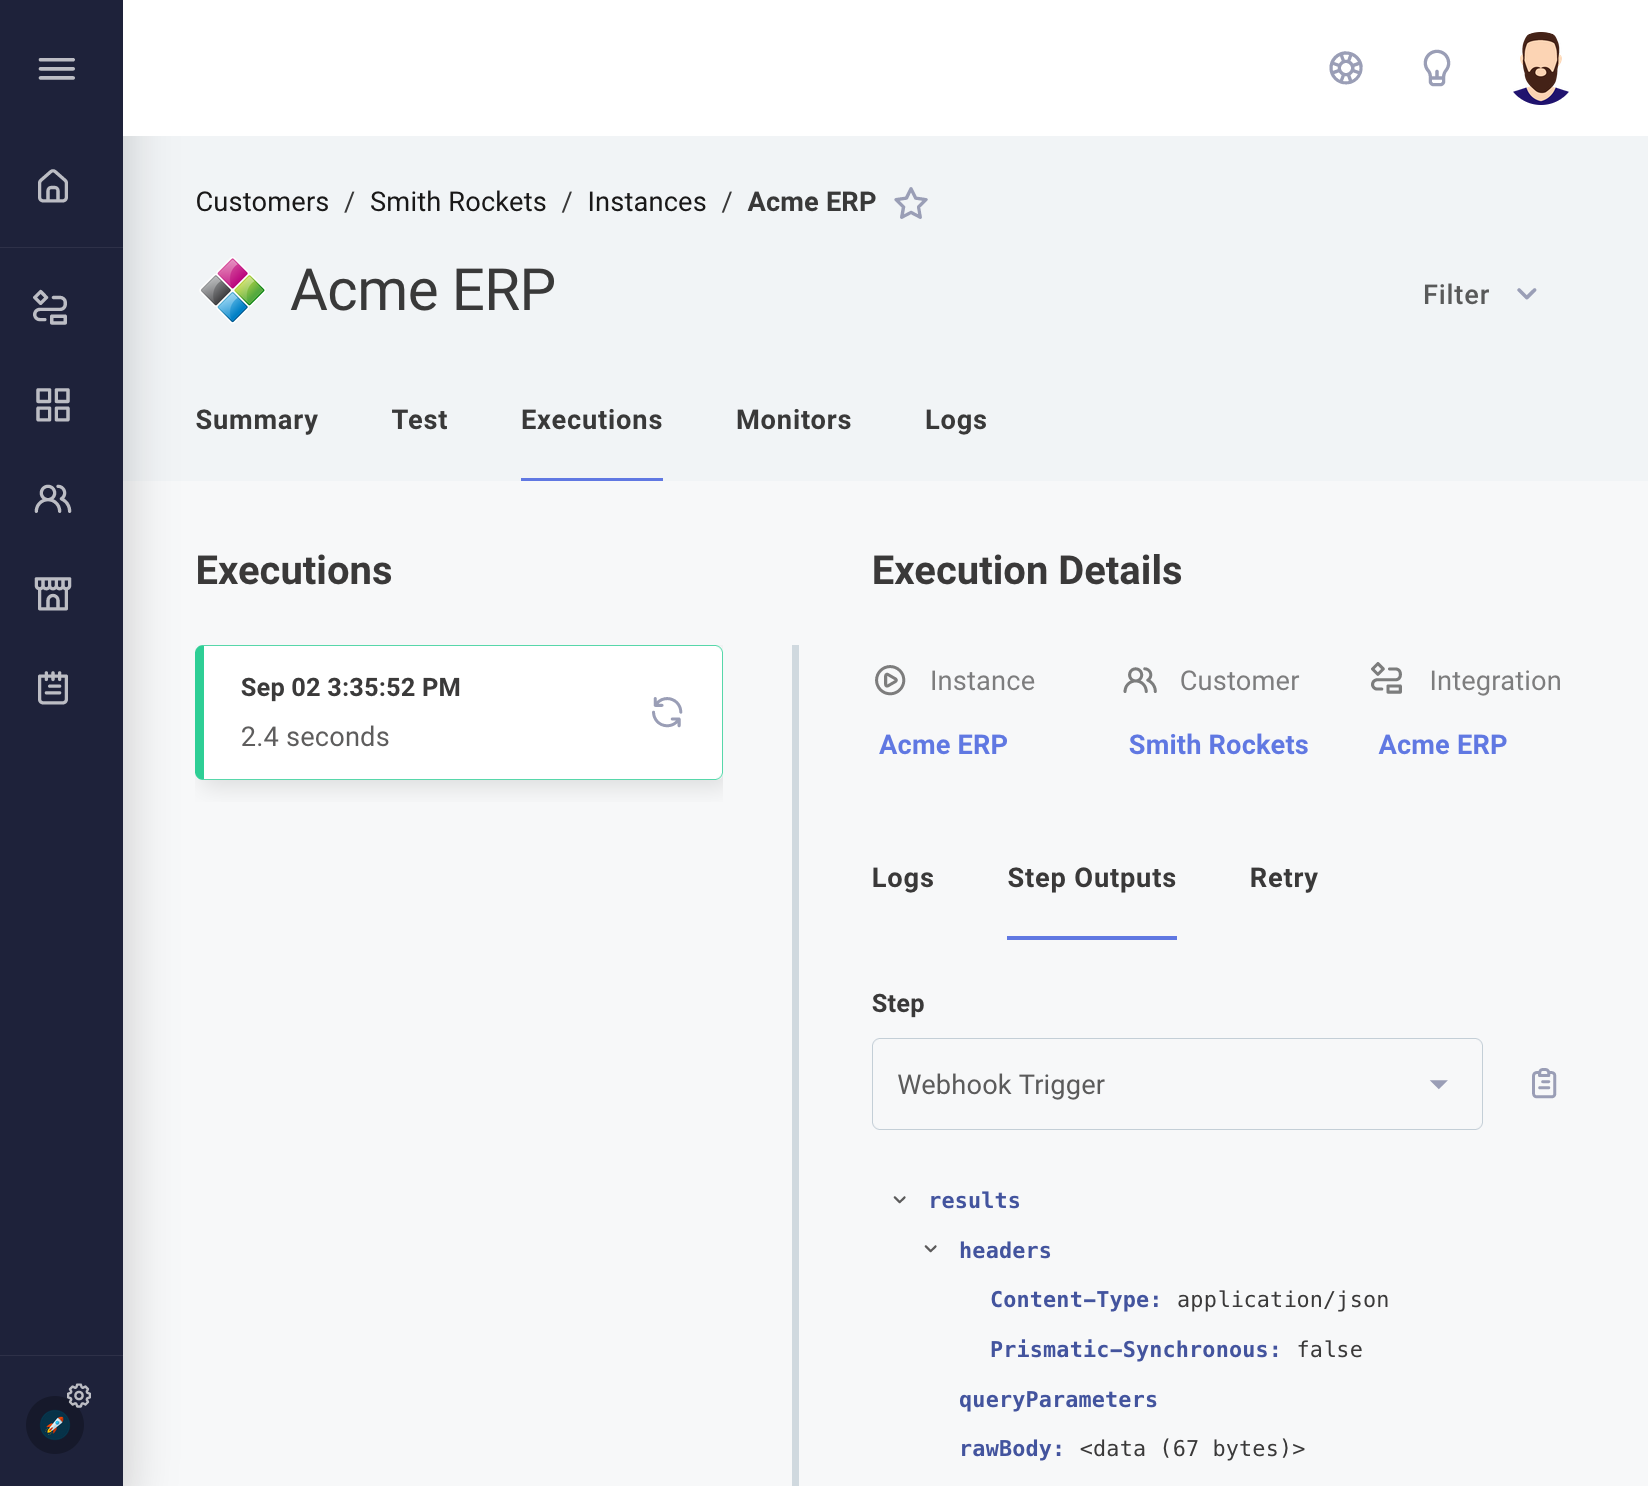
If an instance fails to run to completion, you can review the data passed to the instance when it was invoked to help debug the issue.
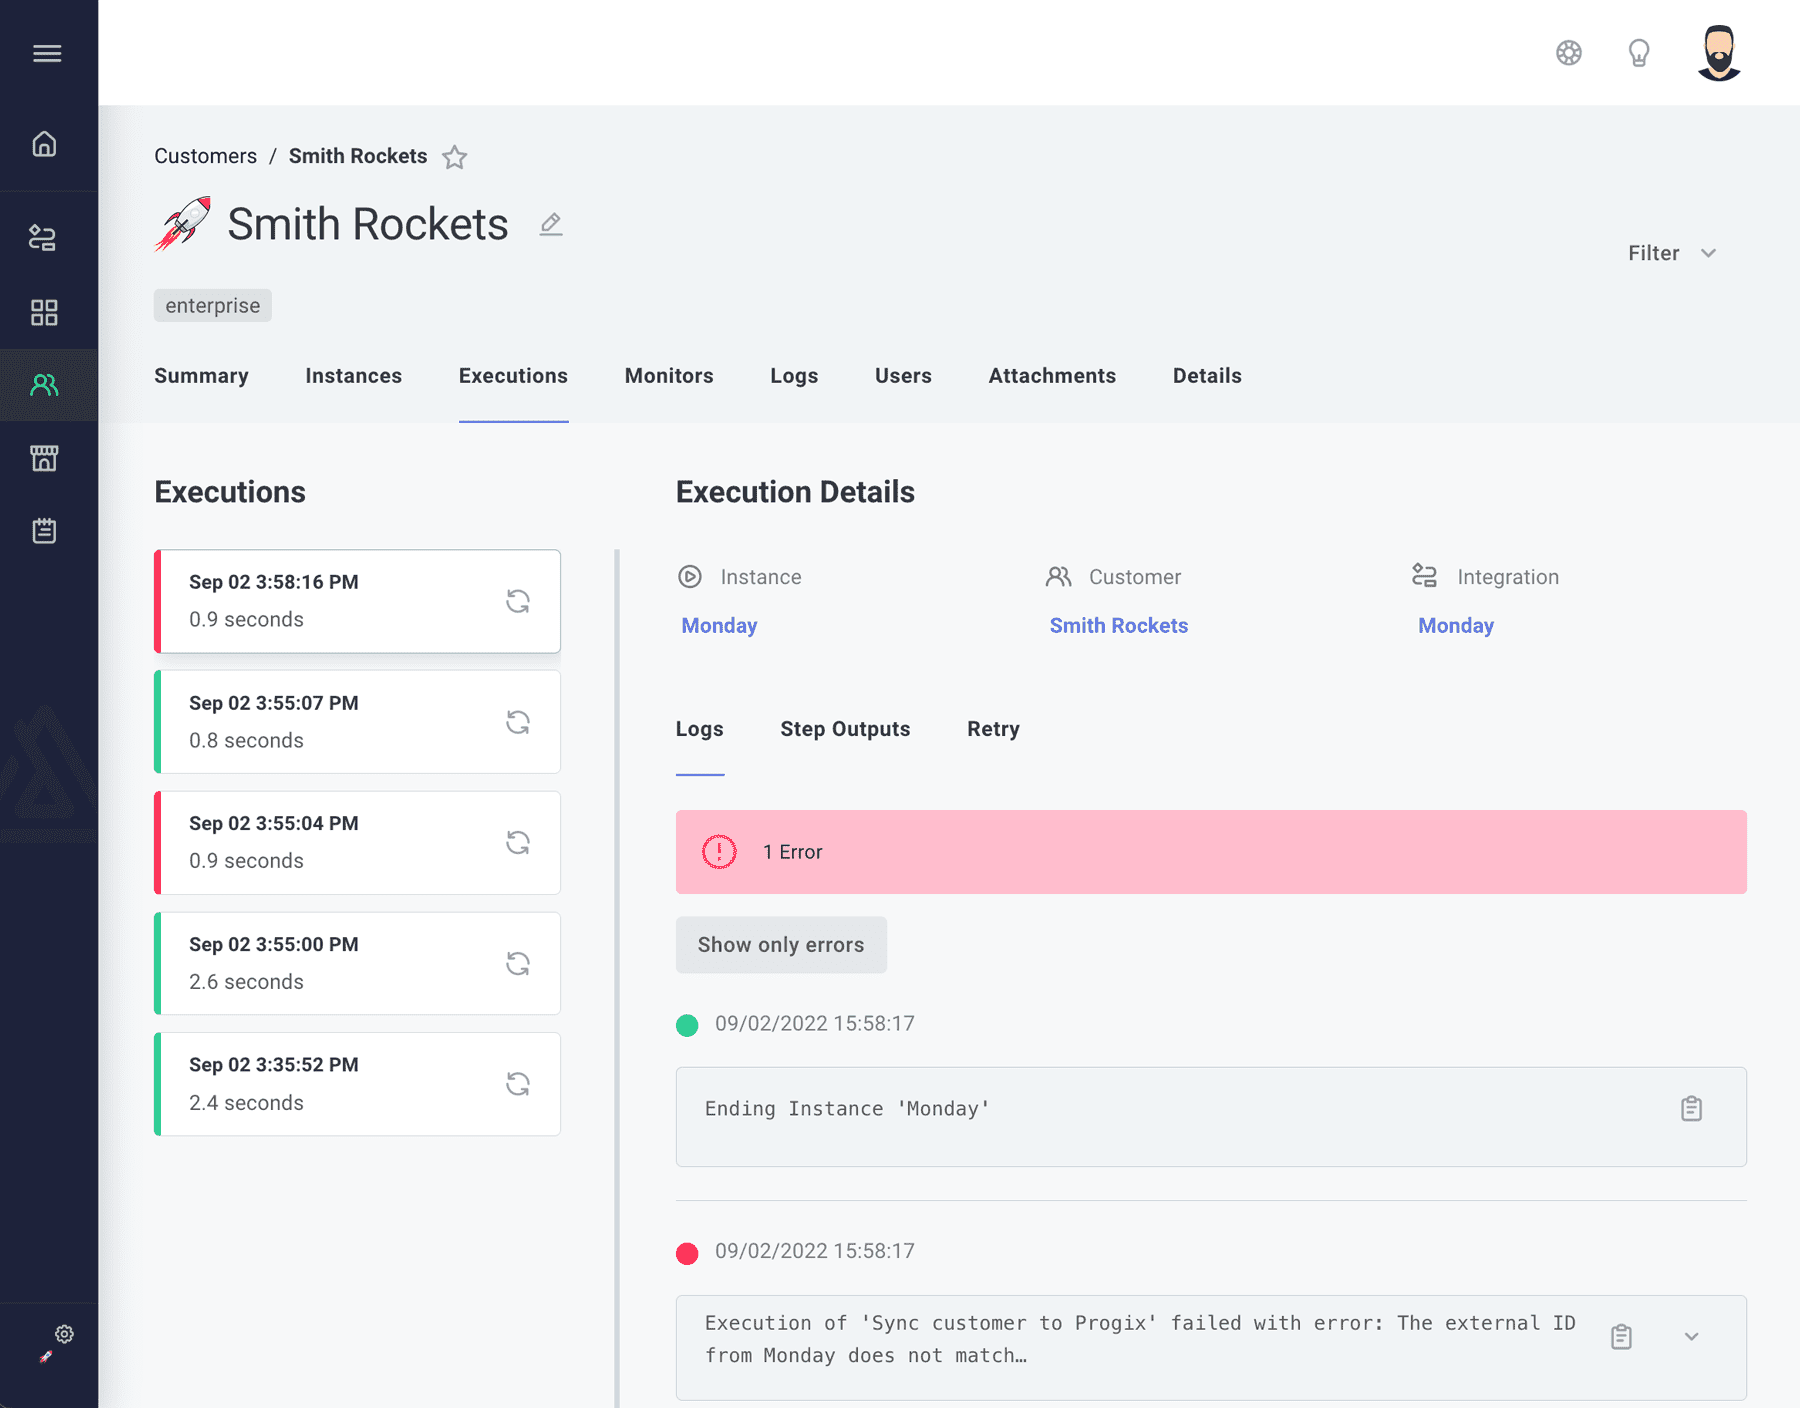
To view results for all instances and all customers, click the Executions link on the left-hand sidebar. To view results for a specific customer, click into the Customer and select their Executions tab.
Instance execution retry and replay
Executions can fail for many reasons - a third-party service might be down, or your integration might encounter an edge case it doesn't handle correctly.
With retry and replay you can re-run failed executions so you don't miss important data.
- Retry allows you to automatically re-run an execution if it fails to run to completion. This is useful if you want to handle temporary outages of third-party apps or services. Following a failure, your instance will re-attempt the execution a configurable number of times, with a configurable delay between each attempt.
- Replay allows you to manually re-run an execution. This is useful if you want to fix a bug in your integration and then re-run an execution with the same payload that caused it to run initially.
Execution retry
Integrations can be configured to automatically retry in the event that an instance fails to run to completion. Information about instance retries can be found on the execution results pages. There, you will see when the instance last ran, and when it will attempt to run again.
An icon beside an execution indicates that Prismatic automatically retried an execution that had previously failed.
Execution replay
To manually retry (i.e. "Replay") an invocation of an instance, click the icon beside any execution run. The instance will be run again with the same webhook payload that caused it to run initially.
To programmatically retry many failed executions, use the executionResults) query to find executions that failed to run to completion. You can then use the replayExecution) mutation to replay the execution.
For an example of how to bulk-replay failed executions, see our examples repository on GitHub or review the Execution Retry & Replay documentation.
Prismatic links replays with the original execution, so you can query for only original executions without a successful subsequent replay.
Adding alert monitors to instances
You can set up instance alert monitors to notify your team of various events, such as failed instance executions, slow executions, or instances in unexpected disabled states. They can be found by clicking the Monitors tab from the instance's page.
For more information: Creating Alert Monitors.
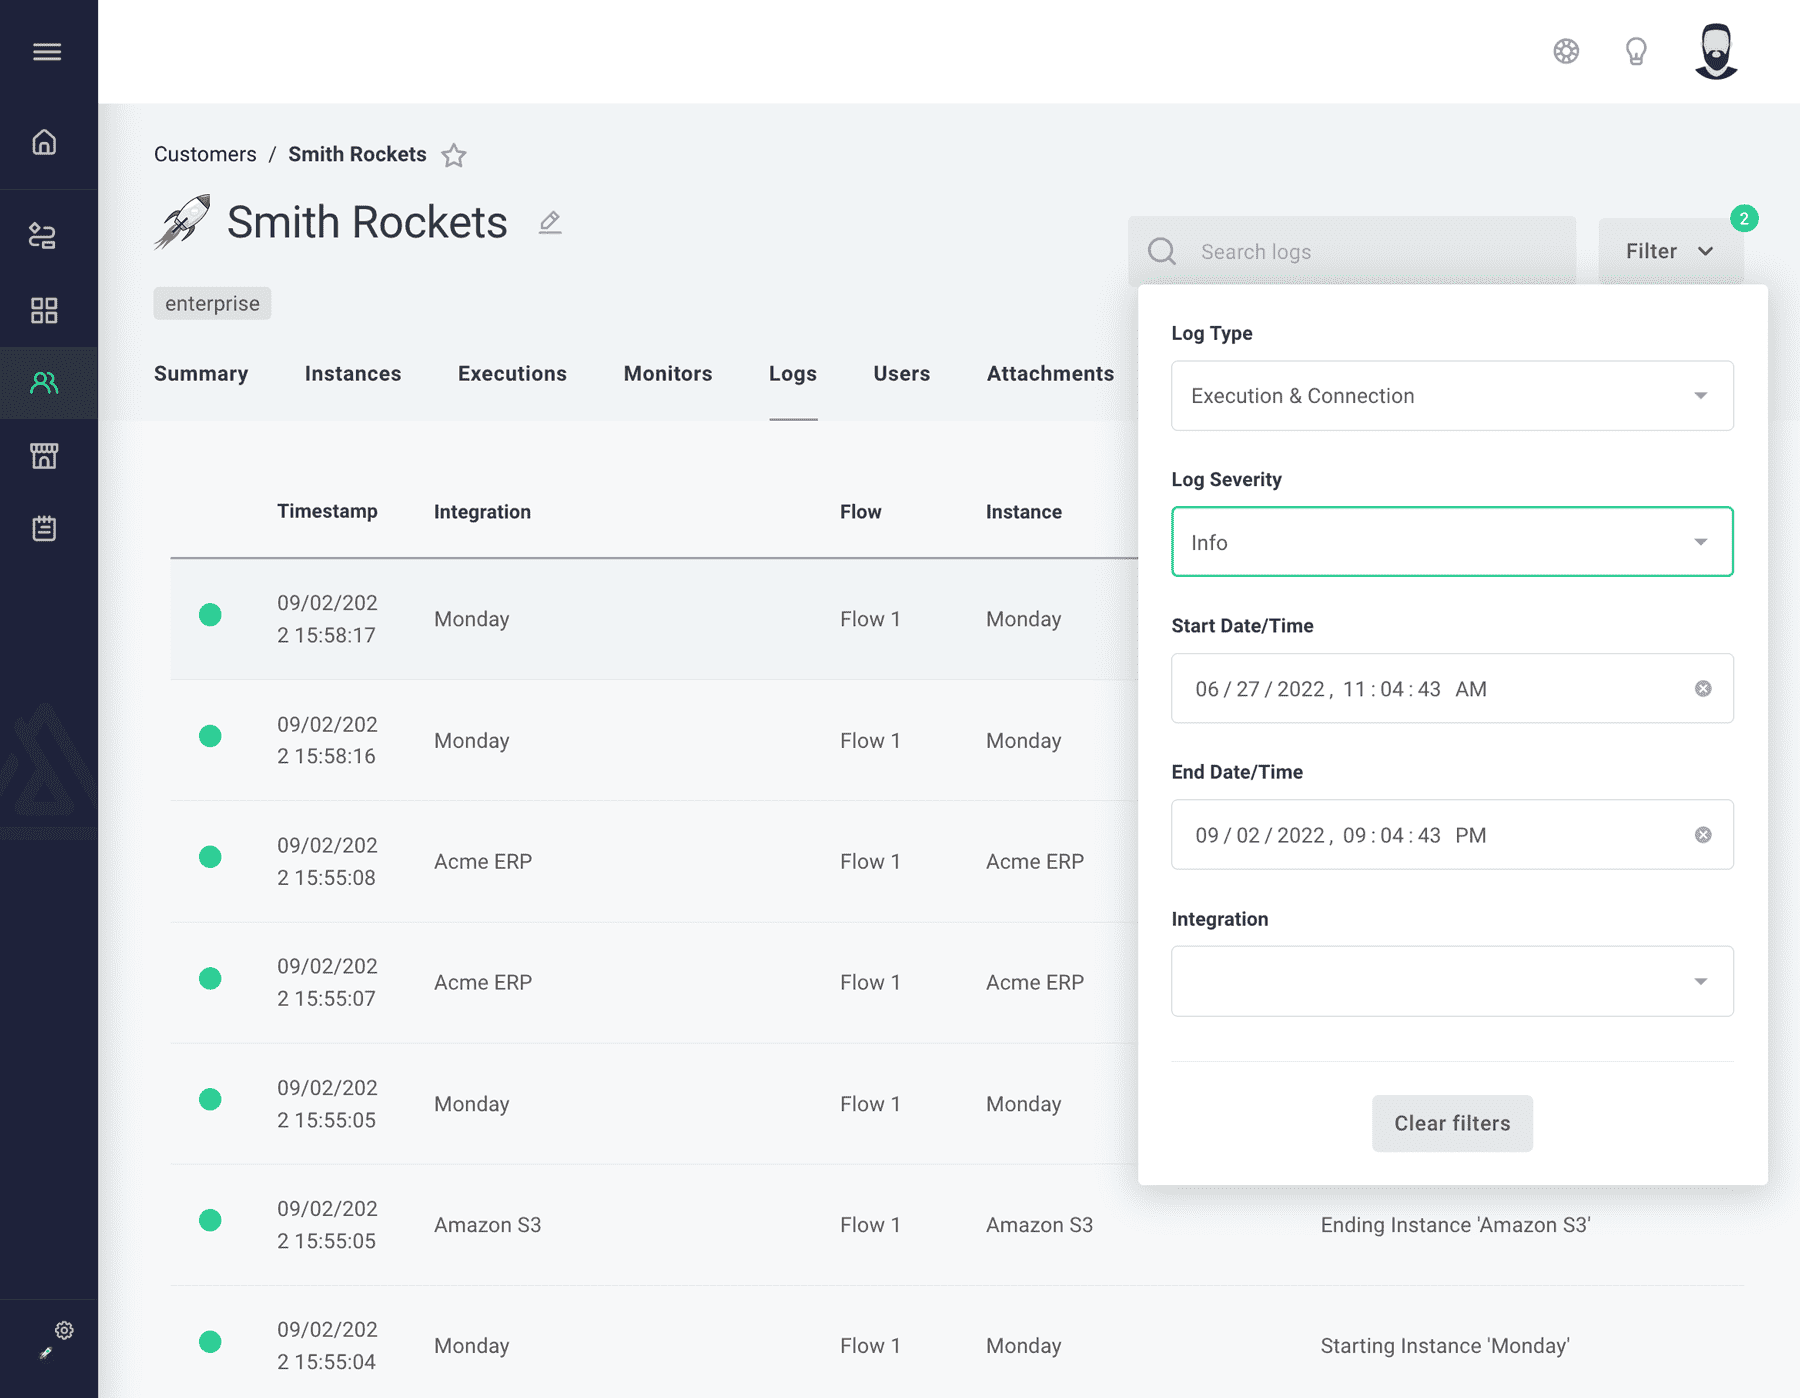
Viewing instance logs
Logs for an instance can be viewed by clicking the Logs tab from the instance's page.
You can search log message text through the Search Logs search bar on the top of the page, and you can filter logs by Log Severity or date range by clicking the Filter link to the right of the search bar.
For More Information: Logging, Log Retention
Deleting instances
Deleting an instance removes the instance and any associated data. Before choosing to delete an instance, consider if you want to disable the instance from running instead.
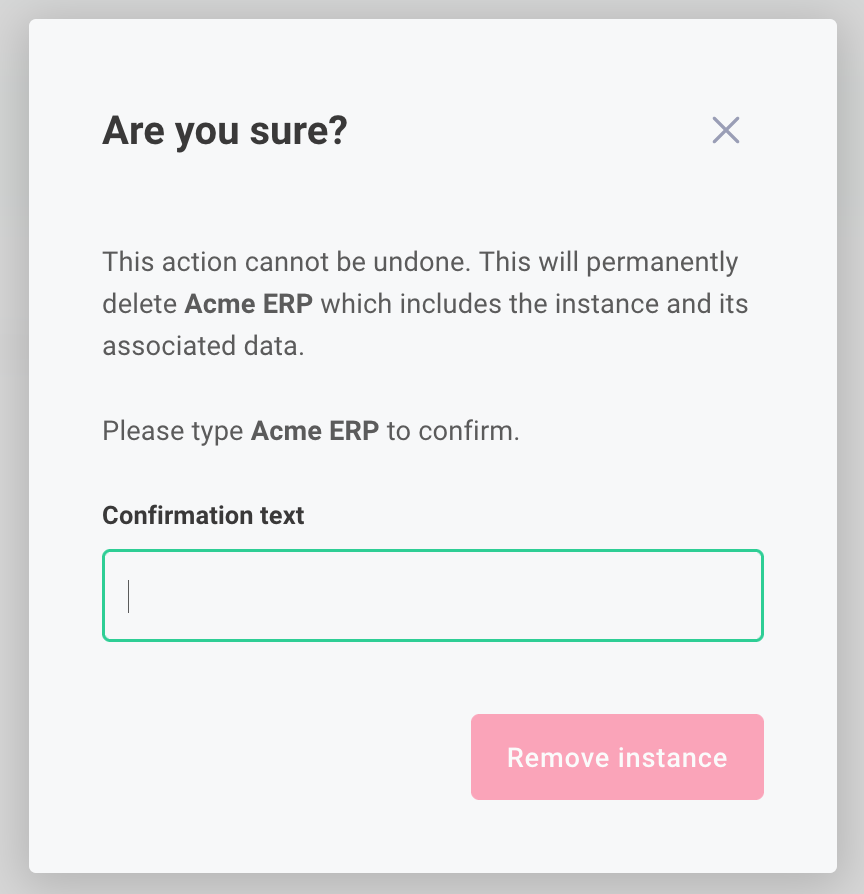
If you choose to delete the instance, scroll to the bottom of the instance's Details tab. Click the Delete instance button, and type the name of the instance in the input field to confirm that you want to delete the instance. Click Remove instance.